Example 5: Doppler Spectrum
In this example, the Doppler spectrum of two boxes moving along the x-axis has been analyzed.
Step 1
Start newFASANT and select GTD-PO.
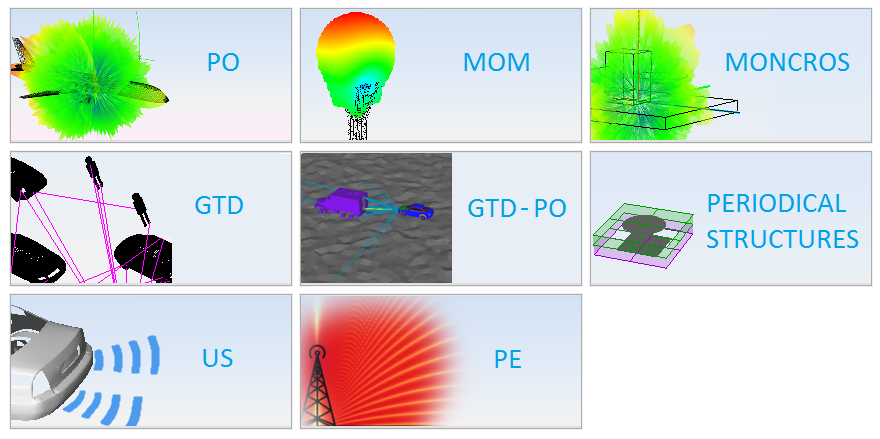
Figure 1. Method type selection.
Step 2
Define the geometry of two boxes.
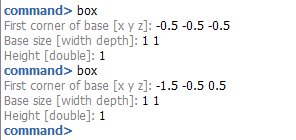
Figure 2. Geometry command.
Step 3
Click on Simulation -> Parameters to change the project parameters
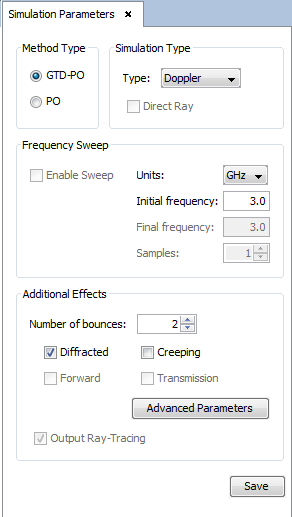
Figure 3. Simulation parameters panel.
Step 4
Now Doppler option in the Simulation menu is available. Click on Simulation -> Doppler. We are going to add doppler effects to the objects in the geometry. Select one box and press the Add button. The selected object is added to the list. Introduce the linear velocity of this object:
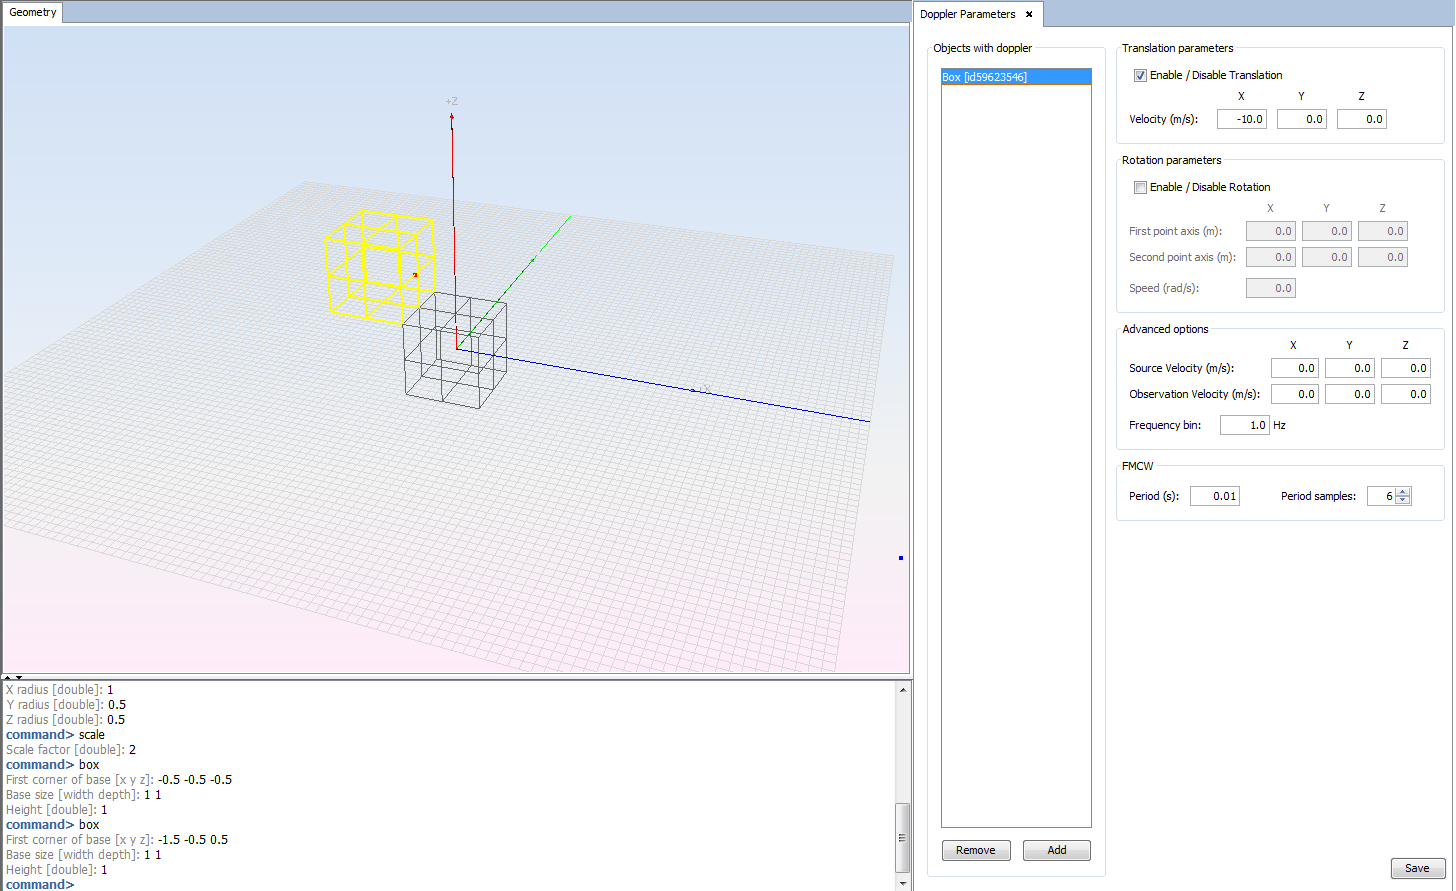
Figure 4. Doppler parameters of the first box.
Select the other box and press Add button. Introduce its linear velocity.
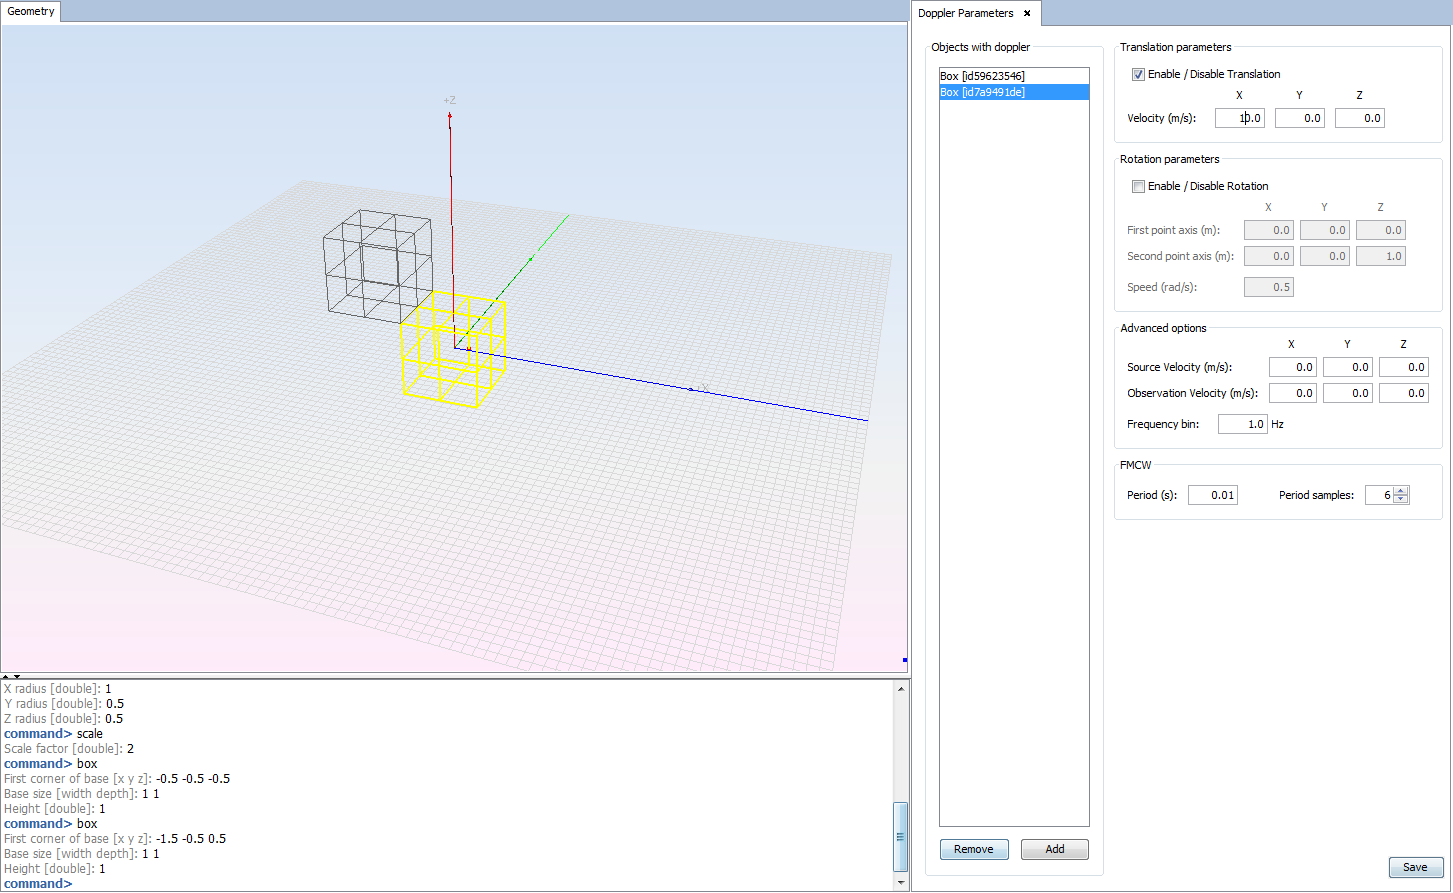
Figure 5. Doppler parameters of the second box.
Step 5
Click on RCS -> Parameters to select Monostatic RCS. As Monostatic RCS has been selected, Output menu is not available.
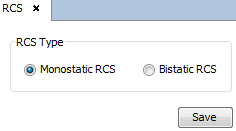
Figure 6. RCS parameters panel.
Step 6
Click on Source -> Parameters to modify the source parameters for this project. Define its position in Cartesian coordinates
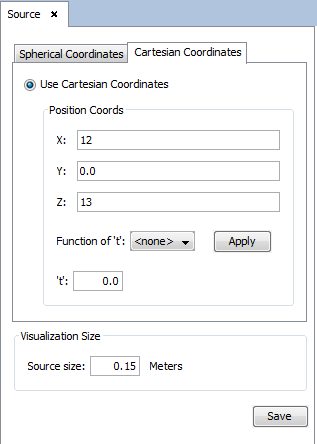
Figure 7. Source parameters panel.
Step 7
Before running this example, create the project mesh by doing click on Meshing -> Create Mesh
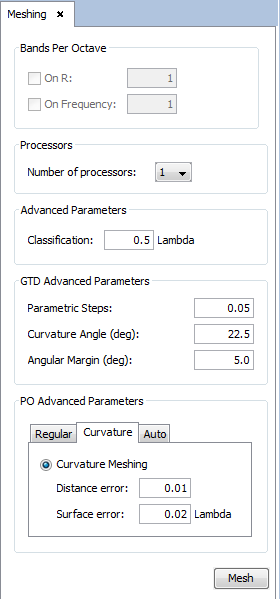
Figure 8. Mesh result.
Step 8
Now we are going to proceed to simulate the project.
Click on Calculate -> Execute and choose the number of processors to use for the simulation. Then click on the Execute button and wait until it ends.
Step 9
Now you can see the results of the simulation by doing click on Show Results -> Doppler -> Doppler Spectrum.
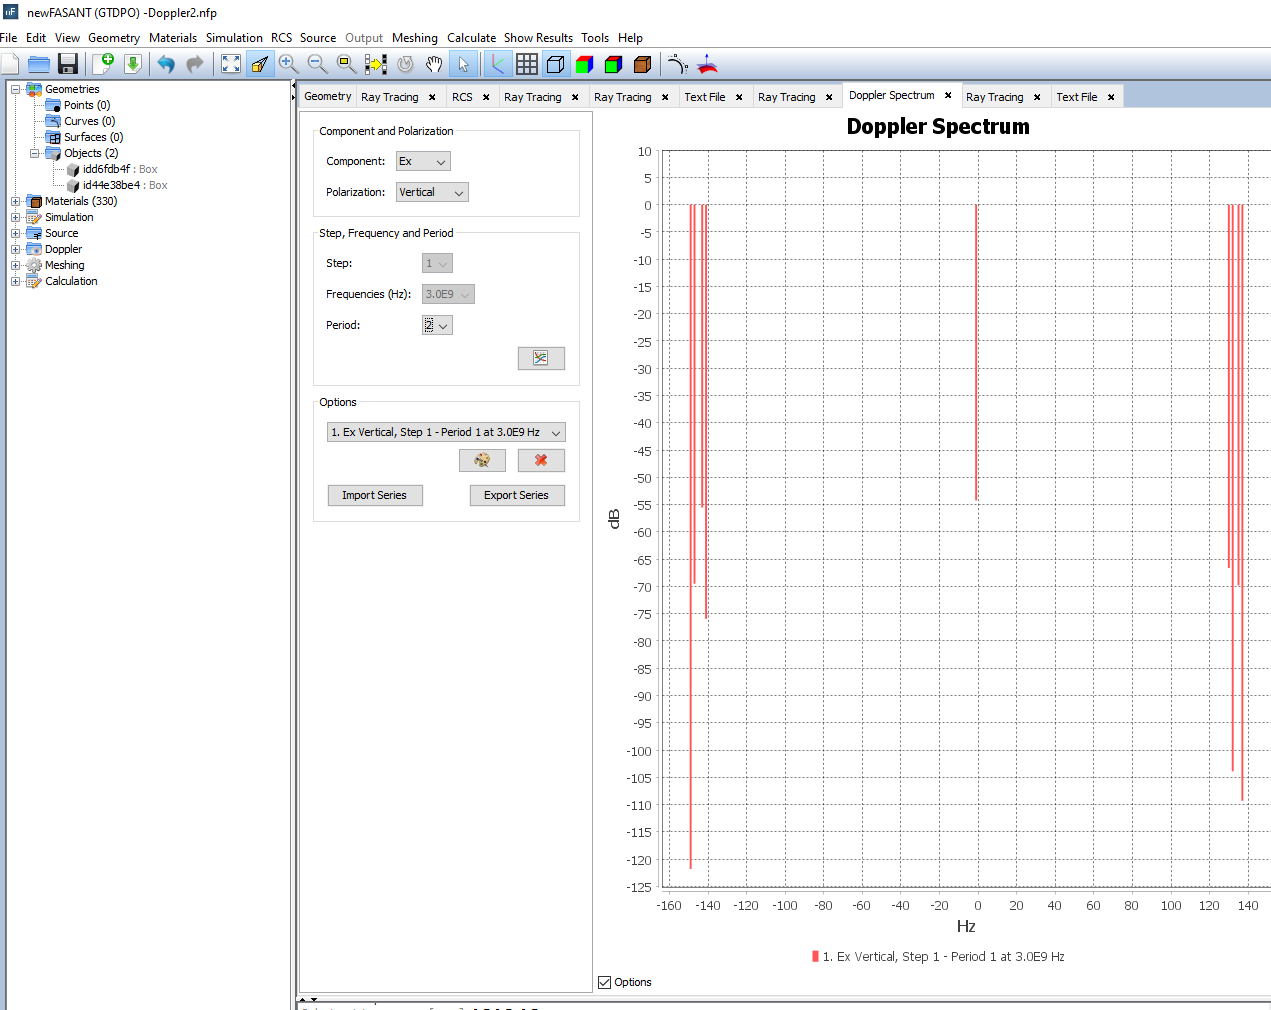
Figure 9. Doppler spectrum results.
Step 10
The ray tracing can be also visualized by doing click on Show Results -> Ray Tracing -> View Ray.
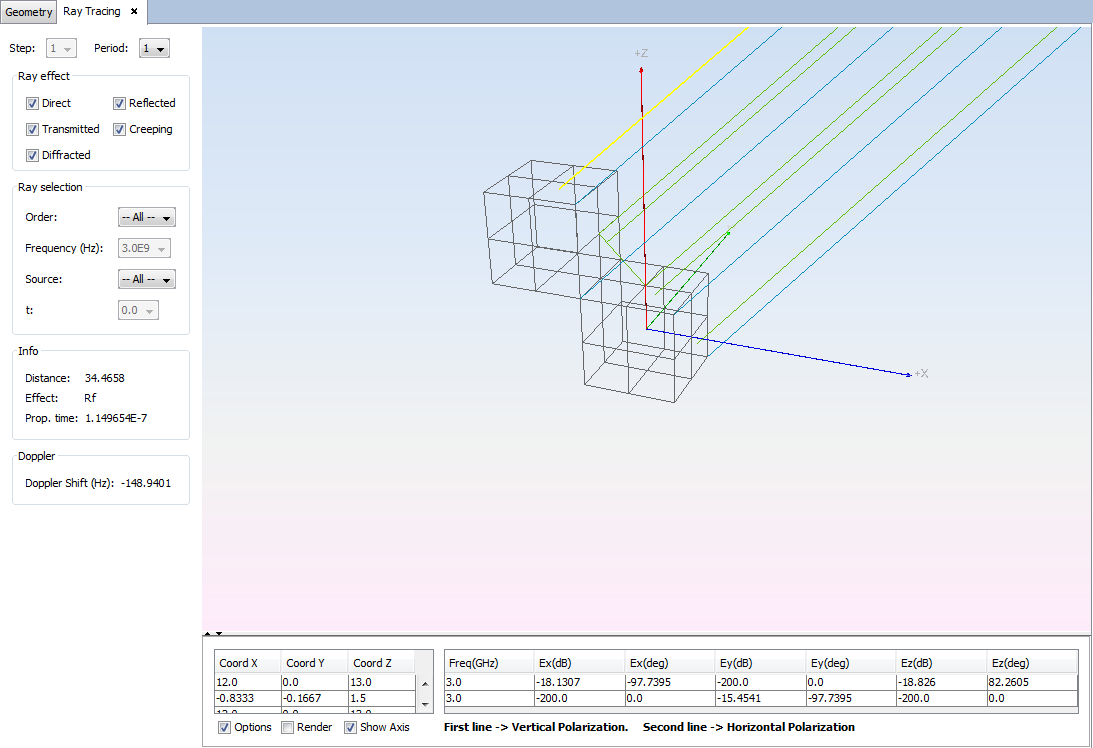
Figure 10. Ray tracing results.