hist
Creates a histogram in an axis.
Syntax
hist(y)
hist(y, x)
hist(y, binnum)
hist(…, property, value, …)
hist(hAxes, …)
nums = hist(…)
[nums, xs] = hist(…)
Inputs
- y
- Values of the histogram.
- x
- Centers of the bins.
- binnum
- Number of bins; defaults to 10 bins if omitted.
- property
- Properties that control the appearance or behavior of the graphics object.
- value
- Value of the properties.
- hAxes
- Axis handle.
Outputs
- nums
- A vector of the numbers of elementes in each bin.
- xs
- A vector of the x values of each bin.
Example
Simple hist example:
clf;
d=normrnd(5,2,1,1000);
hist(d);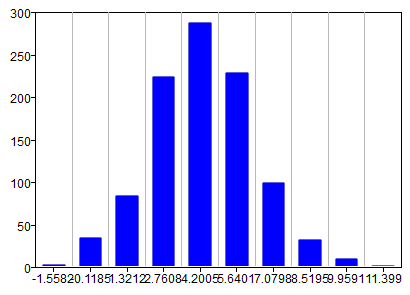
Figure 1. Hist plot
hist example with a return value:
clf;
d=normrnd(5,2,1,1000);
[nums, xs]=hist(d);
bar(xs, nums);Figure 2. hist with return value
Comments
If there is no axis, one will be created first. If bins is omitted, the default number of bins is 10. If the first argument of hist() is an axes handle, hists will be created in that axes.
With return values assigned, hist will not create a histogram, but rather calculate the number of elements in each bin(nums) and/or centers of each bin(xs). The histogram can be created with the command 'bar(xs, nums)'.