contour
Creates a 2D contoured surface in an axes.
Syntax
contour(z)
contour(x, y, z)
contour(hAxes, ...)
contour(..., cn)
Inputs
- x, y, z
- Range of the x, y, and z axes.
- hAxes
- Axis handle.
- cn
- Optional argument to set the number of contours, changing the number of colors in the colormap. The number of colors is limited to 32.
Examples
contour
example:
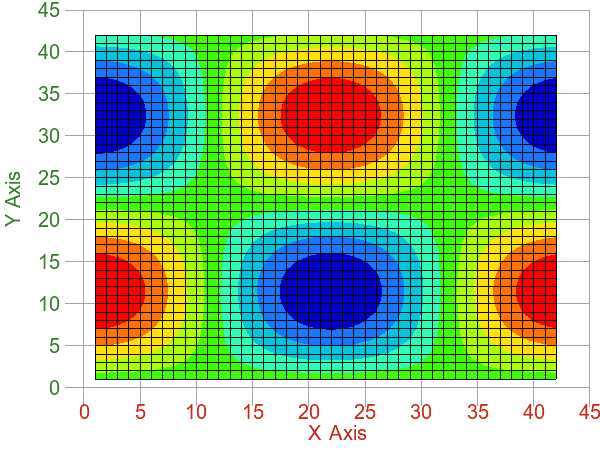
Figure 1. Contour plot
cla;
x=[0:0.15:2*pi];
y=x;
z=sin(x')*cos(y);
contour(z);
Figure 1. Contour plot
Number of contours
example:
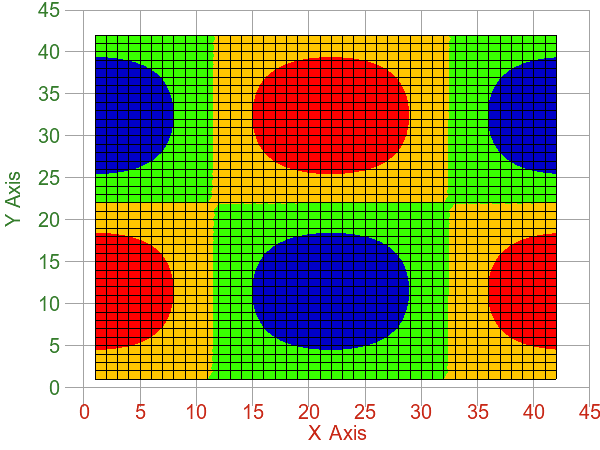
Figure 2. Contour plot with four color levels
cla;
x=[0:0.15:2*pi];
y=x;
z=sin(x')*cos(y);
contour(z, 4);
Figure 2. Contour plot with four color levels
Comments
If there are no axes, one will be created first. If x and y are omitted, the index of the columns of z is used for x coordinates and the index of the rows of z is used for y coordinates. If the first argument of contour() is an axes handle, surfaces will be created in that axes.