Histograms
Histogram of Values
Click . From the sub menu, you can select whether:
- the histogram is to be determined for all prediction planes and all horizontal layers
- for prediction planes and surfaces only
- for all horizontal prediction planes
- for the currently active horizontal prediction plane
- for the zoomed area of the currently active horizontal plane
After selecting the area to be evaluated, you have specify the quantization interval to be used to discretize the result data.
Example
The following example shows a histogram of an angular spread prediction in an urban
environment:
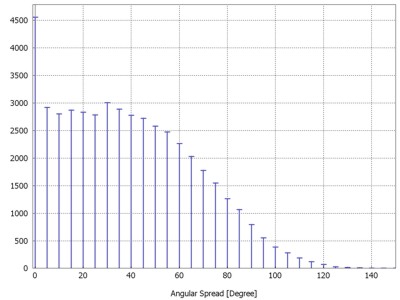
Figure 1. Example of a histogram of an angular spread prediction in an urban environment.
Figure 1. Example of a histogram of an angular spread prediction in an urban environment.