Partial Response and Dynamic Reactions
Plot partial responses and reaction forces for a dynamic analysis.
Purpose
SimSolid performs meshless structural
analysis that works on full featured parts and assemblies, is tolerant of
geometric imperfections, and runs in seconds to minutes. In this tutorial,
you will do the following:
- Plot partial responses and reaction forces in SimSolid.
Model Description
The following model files are needed for this tutorial:
- PartialResponse.ssp
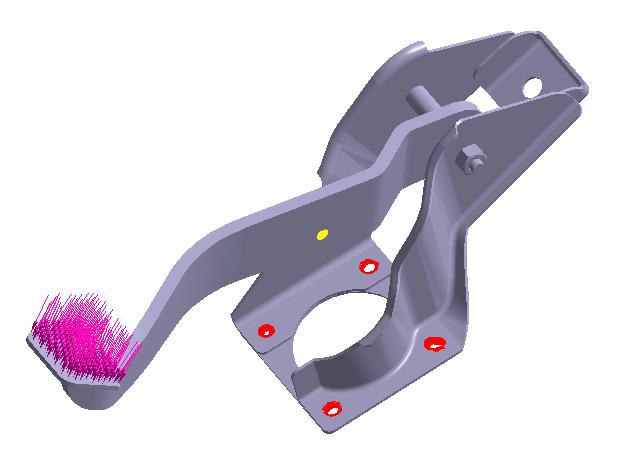
Figure 1.
The project file has the following specifications:
- Regular connections with a 1.5mm gap and penetration tolerance.
- Modal and Frequency Response subcases are pre-defined.
- Solution settings are set to "Adapt to Stiffness."
Open Project
Open the SimSolid project file.
-
Click the
 (Open Project) icon.
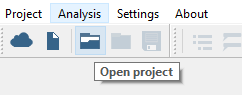
Figure 2.
Edit Solution Settings
Adjust solution settings.
- In the Analysis branch of the Project Tree, double-click on Solution settings: custom.
- In the Solution settings dialog, for Objective select Adapt for stiffness in the drop-down menu.
- Click OK.
Run Design Study
Solve all analyses in the design study.
-
Click
 (Solve).
SimSolid will run all analyses in the design study branch. When finished, a Results branch for each analysis will appear in the Project Tree.
(Solve).
SimSolid will run all analyses in the design study branch. When finished, a Results branch for each analysis will appear in the Project Tree.
Plot Displacement Contour
View a contour plot for displacement magnitude.
-
On the Analysis Workbench, click
 > Displacement Magnitude.
The Legend opens and displays the Displacement Magnitude contour plot.
> Displacement Magnitude.
The Legend opens and displays the Displacement Magnitude contour plot.
Plot Dynamic Response for Point
Select a point and plot its dynamic rseponse.
-
In the Analysis Workbench toolbar, click
 (Pick info).
The Frequency response in picked point dialog will open.
(Pick info).
The Frequency response in picked point dialog will open.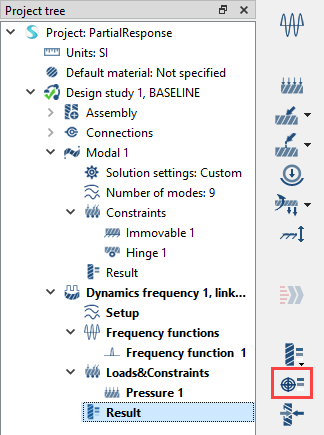
Figure 3. -
Pick a point in the modeling window.
A Dynamic frequency response dialog will open and show the plot for Point 1.
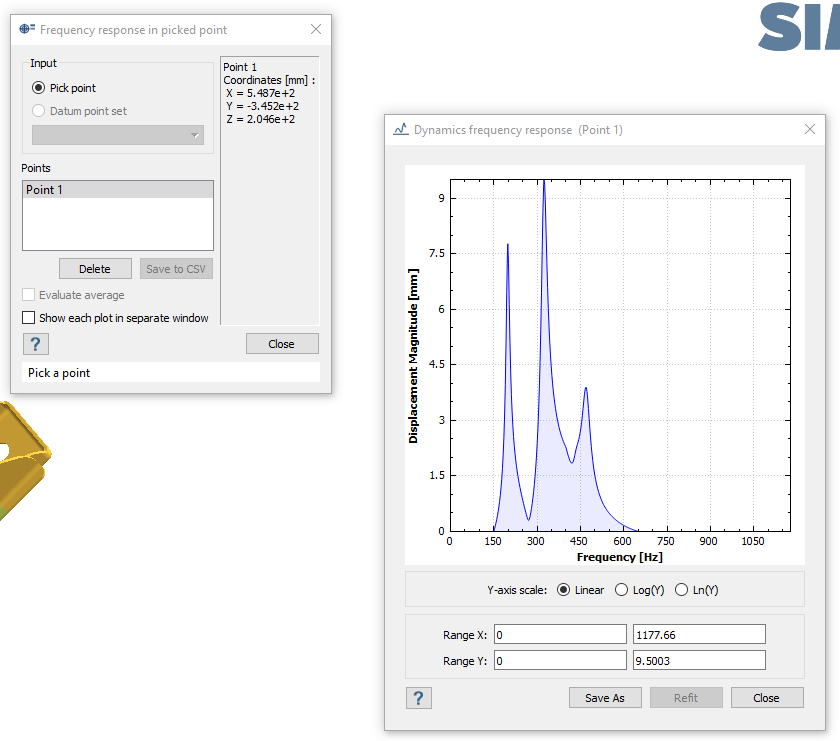
Figure 4.
Plot Partial Response
-
In the Dynamics frequency response (Point) dialog, pick a
point and plot the dynamic response.
A dialog will open showing the plot of the chosen point.
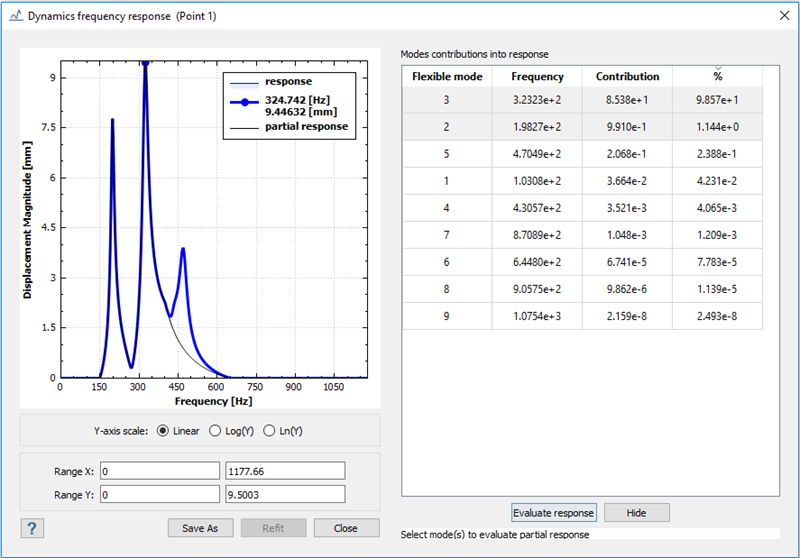
Figure 5.
Plot Dynamic Reaction Force
View dynamic reaction forces.
-
On the workbench toolbar, select the
 (Reaction/contact force) icon.
-
Click Evaluate.
A new dialog will open showing a graph of the chosen force. You can use the radio buttons in this dialog to change Y-axis scale.
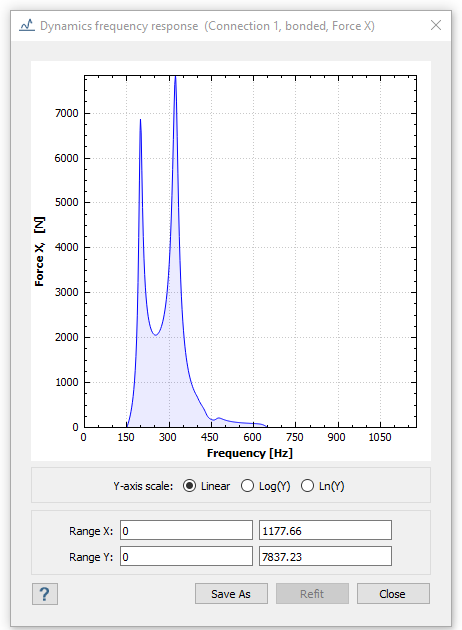
Figure 6.