Stress-life (S-N) Approach
The stress-life method works well in predicting fatigue life when the stress level in the structure falls mostly in the elastic range.
Under such cyclical loading conditions, the structure typically can withstand a large number of loading cycles; this is known as high-cycle fatigue.
When the cyclical strains extend into plastic strain range, the fatigue endurance of the structure typically decreases significantly; this is characterized as low-cycle fatigue, more details about it can be found in the next section.
The generally accepted transition point between high-cycle and low-cycle fatigue is around 10,000 loading cycles.
S-N Curve
The S-N curve, first developed by Wöhler, defines a relationship between stress and number of cycles to failure.
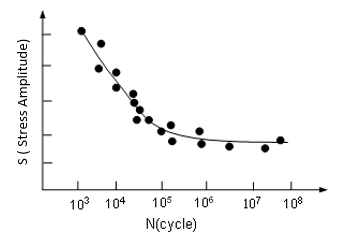
Figure 1. S-N data from testing
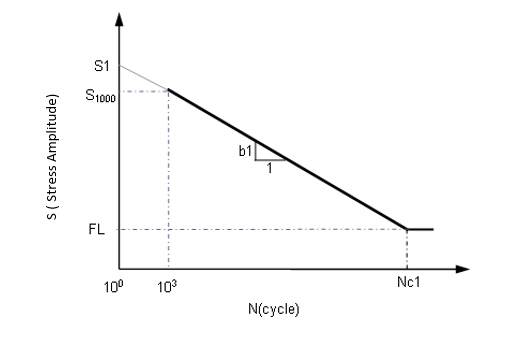
Figure 2. One segment S-N curves in log-log scale
- S is the nominal stress amplitude
- Nf are the fatigue cycles to failure
- b1 is the first fatigue strength exponent
- S1 is the fatigue strength coefficient
- Nc1 is cyclic limit of endurance
The S-N approach is based on elastic cyclic loading, inferring that the S-N curve should be confined, on the life axis, to numbers greater than 1000 cycles. This ensures that no significant plasticity is occurring. This is commonly referred to as high-cycle fatigue.