Create a Dashboard to View the Data
You can use a global template as shown below for both HTTP, similarly, follow the same steps for MQTT.
With this solution you can see the Data how you want, where you want, and fast enough to act quickly.
This tool is powered by Altair Panopticon and supports a wide range of information visualizations, including our well-known Treemaps, Heat Maps, Scatter Plots, Horizon Graphs, and a wide range of other great visualizations designed for fast comprehension and easy interpretation of static, time series, real-time streaming, and historic data sets.
-
Click New Workbook.

-
Select the data you want to use in a Panopticon workbook by clicking the plus
icon. You can create a data table from a template or add a new data table by
clicking Add icon on the Data Table panel of the Open
Workbook layout.
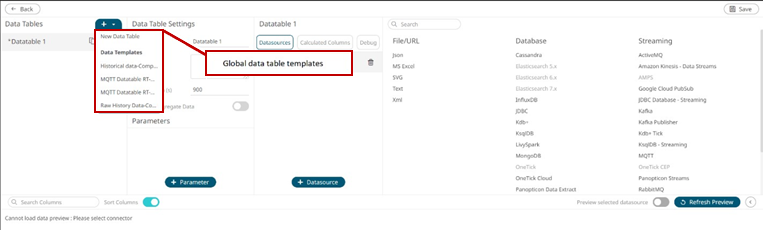
Figure 1. -
If you select to use a pre existing template, complete the Parameters section,
and click to see the data preview. Remember to click Save
before returning to the Visualization panel.
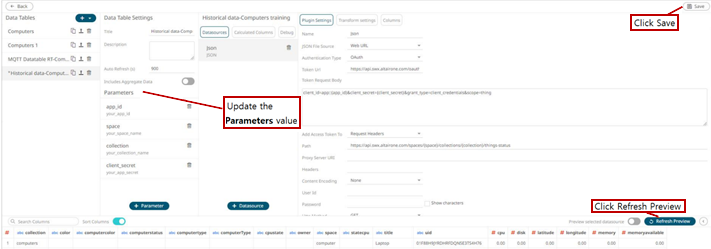
Figure 2.