


|
Using the Multi-Column Region (MCR) Trapping Feature
Monarch Classic's multi-column region (MCR) trapping capability enables Monarch Classic users to trap and extract data from reports that have a layout similar to that of a newspaper, i.e., ones with multiple, adjacent columns of data on each page.
General steps to trap data via the MCR feature
Steps:
-
First, you define the multi-column region via the Multi-Column Region Definition dialog.
-
Second, you create a template to extract the data from the report.
-
Third, you specify the vertical boundaries (i.e., beginning and ending points) for the columns.
Using the MCR trapping feature in detail
Steps:
-
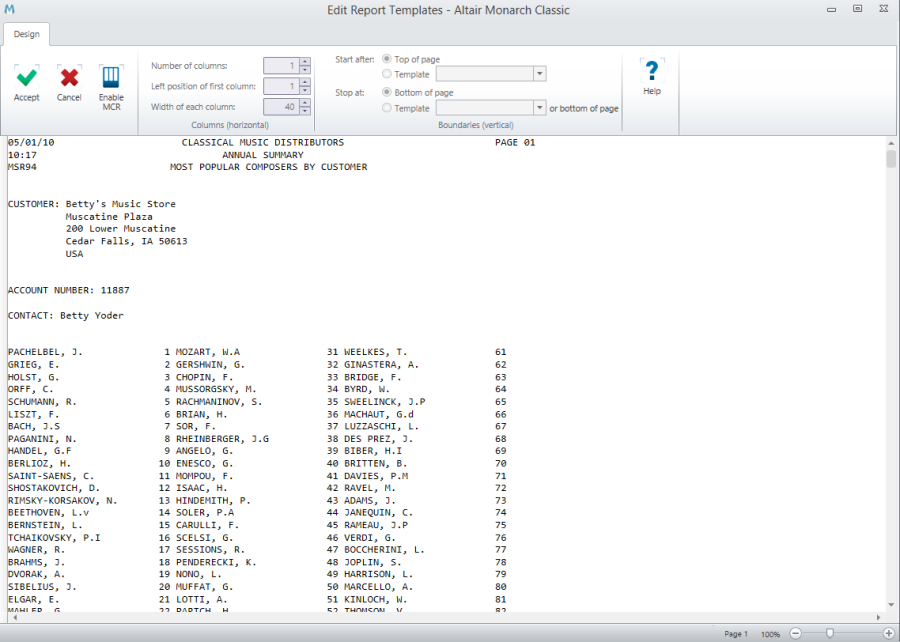
Open the report from which you want to extract multiple-column data and then go to Report Design.
-
Select Multi-Column Region from the Report Design ribbon. The Multi-Column Region Definition window displays.
-
Select Enable MCR.
-
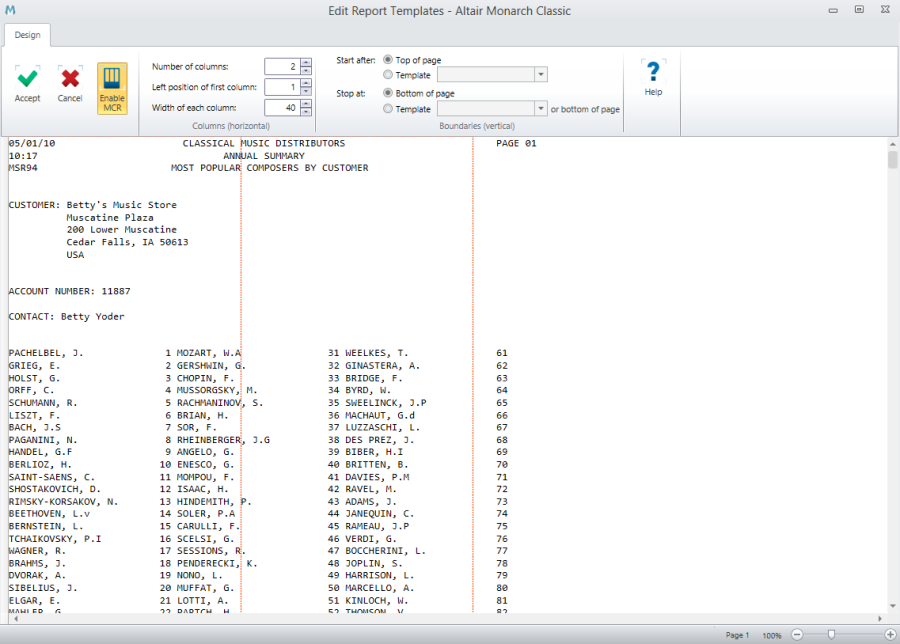
Examine the report to determine how many columns of data there are, then enter the number in the Number of Columns field.
-
Use the Left Position of First Column box to specify a left margin for the leftmost column, i.e., the position where you want the leftmost column to begin. The column indicators are shifted to the left according to the number of spaces you entered in the box.
-
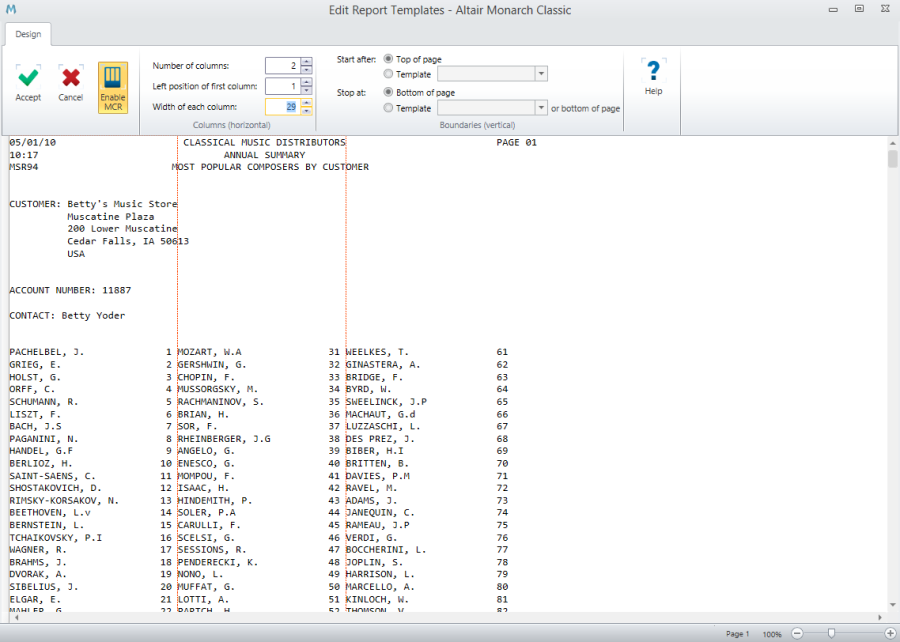
Use the Width of Each Column box to specify the desired column width. To do so, either enter a number in the box or use the arrows to increase or decrease the current column width.
-
Click the Accept button to accept the current MCR settings and return to the Template Editor. Note that the column indicators are still displayed on the Report window.
-
To the left of the first line of data you want to trap, click in the line selection area to highlight the line. Note: To select multiple lines, click down in the line selection area to the left of the first line, then drag down to the last line and release.
-
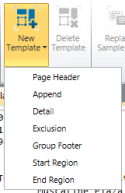
On the Report Design ribbon, select New Template. You are asked to select a template role:
-
Select the appropriate template role from the role drop-down. Monarch Classic splits the Report window between the Template Definition dialog at the top, and the report at the bottom. The selected detail lines are displayed in the Sample edit box at the bottom of the dialog.
-
Create traps to extract the desired fields, as you would with any non-MCR template, and then name the template.
-
Select Verify from the Report Design ribbon to make sure the fields in your template have been defined properly.
-
Select Multi-Column Region from the Report Design ribbon. The Multi-Column Region Definition window displays.
-
Under the Boundaries (vertical) group, select a Start After option to specify the top boundary of the MCR.
-
Repeat step 15, this time selecting a Stop After option to specify the bottom boundary of the MCR.
-
Click the Accept to save the current MCR settings. Monarch Classic returns you to report Report Design.
-
To view the trapped data, go to Table View or select the Preview tab of the Template Editor.
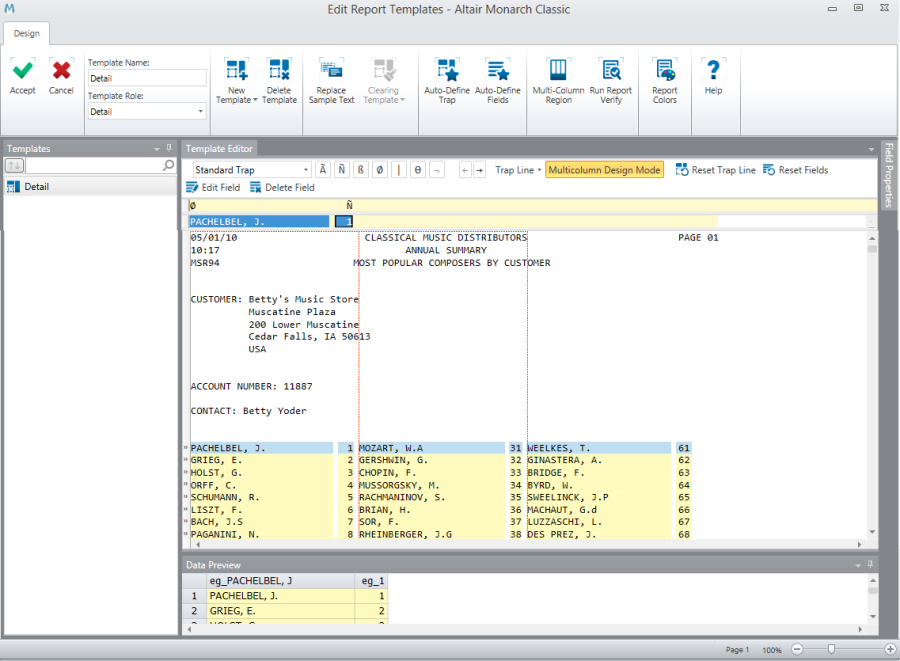
A series of red, vertical broken lines, or column indicators, appears over the report to indicate where the columns currently are. The number of columns you specified determines the number of column indicators that appear (e.g., if you specified 3 in the Number of Columns box, three column indicators appear).
Note: The default Left Position of First Column setting is "1". If the text in the leftmost column begins at the left edge of the report, leave the setting at "1". If the text begins one space in from the left edge of the report, enter "2". If the text begins two spaces in from the edge of the report, enter "3", and so on.
The column indicators move to reflect the change to the column width. Examine the current column width and, if necessary, adjust it so that each column of data is entirely contained within each column as outlined by the column indicators.
Once you have determined the number of columns, the starting position of the leftmost column, and the column width, you are ready to define the template to extract the data.
Note that the Multicolumn Design Mode check box is selected. Note also that only the leftmost instance of the data you selected in step 8 is displayed in the Sample Edit box. This is because, based upon the MCR settings you specified, Monarch Classic now considers the multiple columns as one column. If you were to clear the Multicolumn Design Mode check box, all the data in the line you selected would appear in the Sample Edit box.
If you have templates defined before and/or after your newly created template, you may need to specify vertical boundaries.
Select the Top of Page option to begin the MCR at the top of the page. To begin the MCR immediately after a particular template, select the Template radio button, then select a template from the drop-down list.
Note that the top boundary line of the MCR (i.e., the red, horizontal broken line at the top of the columns) is adjusted to reflect the setting you’ve specified. This line indicates the top boundary of the multi-column region. Everything above this line is excluded from the MCR.
Select the Bottom of Page option to end the MCR at the bottom of the page. To end the MCR immediately before a particular template, select the Template radio button, then select the template from the drop-down list.
Note that the bottom boundary line of the MCR (i.e., the red, horizontal broken line at the bottom of the columns) is adjusted to reflect the setting you’ve specified. This line indicates the bottom boundary of the multi-column region. Everything below this line is excluded from the MCR.
Note: As you can see, templates can be very helpful when specifying the top and bottom boundary settings of the MCR. Keep this in mind, as you can create blank or dummy traps solely for this purpose.