Post-processor Verification and Validation
HyperView - Complete Model Results Compared for All or Any Subcase/Simulation/Datatype
All Scalar, tensor, and vector results are processed. Nodal and elemental results are included for all subcases and simulations.
Results are compared based on global tolerance or user defined tolerance at the datatype level. You can compare results across different HyperView versions for the same solver results.
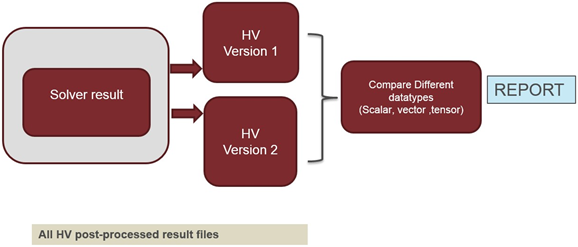
Figure 1.
HyperGraph
You can compare plot or time history results for all or any Type–Request–Component (TRC).
Current and reference curves are plotted along with the difference curve. The difference curve, with all statistical details, is also presented for easy decision making.
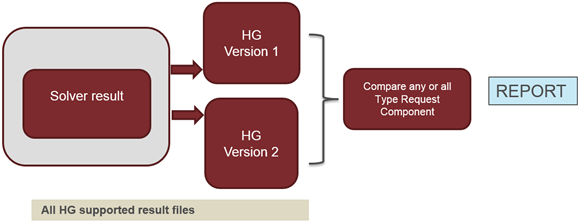
Figure 2.