The Solver version result comparison HG tab performs time history comparisons. From
this tab, you can perform the curve super positioning of the current and reference version
result files and plot the differences in curves.
-
Click the Solution tab then the Solver
version result comparison HG tab.
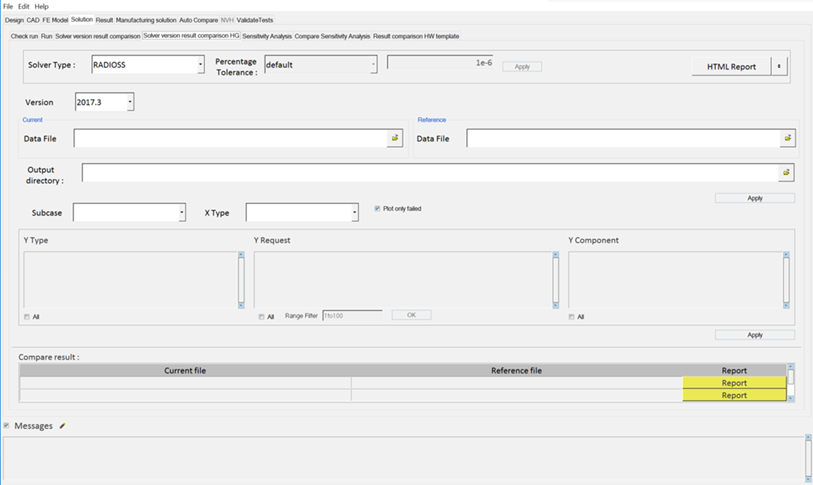
-
Select Radioss or
OptiStruct as the
solver type from the drop-down menu.
-
Select the current HyperWorks version from the
Version drop-down menu.
-
Choose between a PowerPoint or
HTML report of the result value comparison.
-
Select the current and reference data file.
-
Select an output directory.
-
Click Apply to extract TRC information from the data
file.
-
Select a subcase from the drop-down menu.
-
Select an X type from the drop-down menu.
- Optional:
Activate Plot only failed to plot only failed
graphs.
-
Select any combination of Y Type, Y Request, and Y Component values from the
populated areas.
Click All to select all items listed.
-
Click Apply to generate TH plots with the selected Y
Type, Y Request, and Y Component.
The Compare result section displays the current file
and the corresponding reference file. Click Report to
display the diff report detailing the differences between files.
Tip:
- Click Messages to view any
error messages.
- Click Html
Report to generate an HTML report of your
session information for any number of files run through the
process.