Edit Legend
The Edit Legend dialog allows you to change the legend properties.
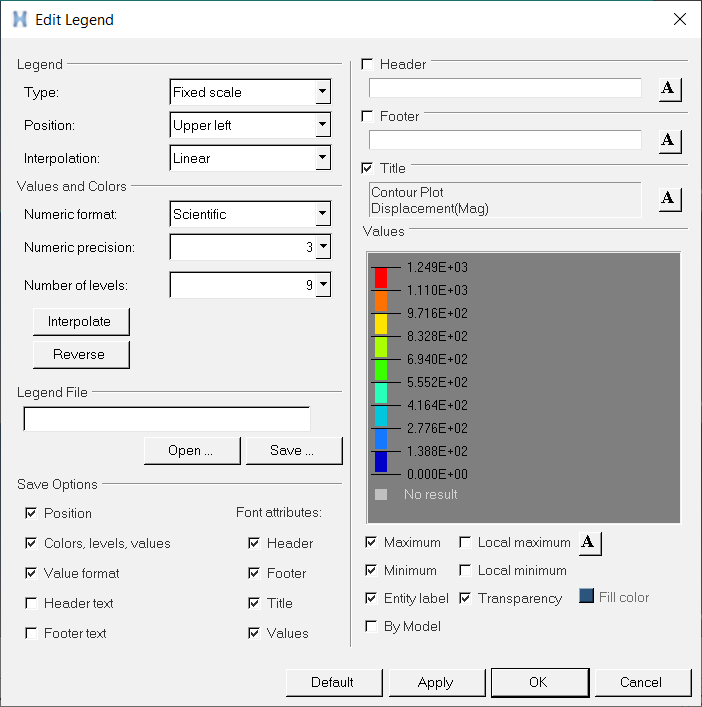
Figure 2.
| Legend | ||
| Type |
|
|
| Position | Select the position of the legend within the HyperView window (Upper left, Upper right, Lower left, or Lower right). | |
| Interpolation |
Note: If the result value range is invalid, the legend cannot be set to Log (a
notification message “Unable to set the legend filter” is displayed in the
status bar at the bottom left corner of the window). If legend is already set to
Log, changing the result data type, or applying an offset to contour or change
in loadstep/loadcase will cause an invalid value range and the legend will be
restored to Linear scale (a warning message “Current result range is invalid for
log legend. Legend has been switched back to Linear scale” will be written into
the message log). Any attempts to override invalid Logarithmic scale legend
values will be rejected in the GUI with appropriate messages posted to the
status bar or the message log.
|
|
| Values and colors | ||
| Numeric format |
Note: *DefineNumericFormat() can be added in the preferences_post.mvw
file, to define the default setting for numerical presentation in the
legend. See the Preference Files topic for more information on specifying
defaults in a preference file.
|
|
| Numeric precision | You can increment the current value from 1 to 12 decimal points. | |
| Number of levels | Displays more or less contour bands along with their respective ranges. The minimum number of bands you can display in a legend is 2; the maximum is 32. | |
| Reverse | Reverses the legend values assigned to the contour bands. | |
| Interpolate | Interpolates the colors in between the two colors that you select. After clicking Interpolate, use the legend within this dialog to select a color to interpolate from and a color to interpolate to. When you select Interpolate, the program displays contour colors for each frame based on the linearly interpolated values between the zero value in the undeformed shape and the solver reported values. | |
| Legend File | ||
| Open | Opens a previously saved legend in Tcl format. | |
| Save | Saves the current legend in Tcl format. | |
| Save Options | Select any of the options listed to save them along
with the current legend. Font attributes allows you to save the current font settings. |
|
| Header | Displays the legend header. To remove the header,
deactivate the check box. To enter a new header, highlight the existing text, type
in a new header and click Apply. Click the font button,
|
|
| Footer |
Displays the legend footer. To remove the footer, deactivate the check box. To enter a new footer, highlight the existing text, type in a new header and click Apply. Click the font button, |
|
| Title | Displays the title of the legend. The title reflects
the settings used to generate the contour and cannot be changed. Click the font
button, |
|
| Values | Click on a color to select a new color from the
color palette. Click on the value to set a user-defined value. The number is displayed in bold face style to indicate the custom setting. To reset the number, click on the number and erase all digits. The legend values between two custom settings are linearly interpolated |
|
| Maximum/Minimum | Displays the maximum and minimum legend values. Deselect the option to remove the minimum and maximum values from the display. | |
| Local maximum/Local minimum | Displays the local maximum and local minimum of a particular time step or
simulation. Note: This option is available only in transient mode with a static
legend.
|
|
| Entity label | Displays the entity label for the maximum, minimum, local maximum, and local minimum legend values (if these options have been selected). Deselect the option to remove the entity label from the display. | |
| By Model | Displays the maximum and minimum legend values for each overlaid model
separately. Important: This option is for multiple/overlaid models
only!
|
|
| Transparency | Displays the legend with a transparent background. Deselect the option to display the legend with the background color which is currently displayed in the color box (located to the right of the Transparency option). | |
| Fill color | Displays the legend with a color background (if the Transparency option is deselected). To select a color for the legend background: click the color box to display the color palette, select a color, and click OK. | |
| Font button |
Click the font button to change the font type, style, and size. | |
|
Note: The legend is displayed on the right side of the dialog, allowing you to
preview changes as you make them.
|
||
| Default | Resets the default legend properties. | |
| Apply | Applies the changes made to the legend. | |
| OK | Applies the changes and exits the Edit Legend dialog. | |
| Cancel | Disregards the changes and exits the dialog. | |