Define
Edit existing curves and add new curves to the current plot.
The Define panel also provides access to the program's curve calculator.
Create and Define Curves
To edit a curve, it must first be selected either from the curve list or picked from the window.
The phase, magnitude, and frequency vectors are displayed at the top of the Define panel. The data sources for the vectors are displayed in the text fields. Click the Phase, Magnitude, or Frequency vector radio button or in the corresponding text box to select that vector for editing.
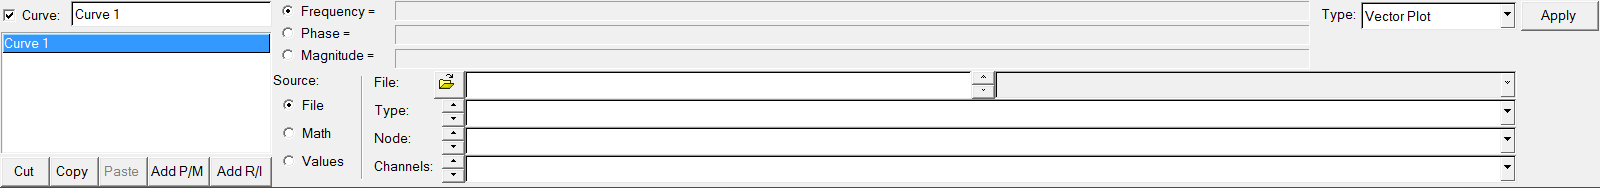
Figure 1. Frequency, Phase and Magnitude vectors, Phase/Magnitude format, on the Define panel
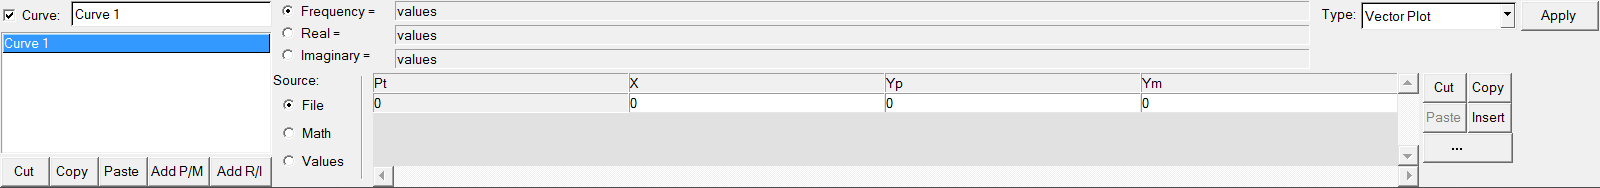
Figure 2. Frequency, Real, and Imaginary vectors, Real/Imaginary format, on the Define panel
New data can be selected from a source file, mathematically defined using the program's curve calculator, or entered as values. The Define panel changes depending on which source is selected.
Curve List
The curve list displays the names of all the curves in the active window. Curves can be renamed, added, cut, copied, and pasted using the curve list controls.
Individual curves can be turned on or off. To turn a curve off, select the curve from the list or pick the curve from the window and deactivate the check box next to the curve name above the curve list. To turn a curve on that was turned off, activate the check box.
The Cut, Copy, Paste, Add P/M and Add R/I buttons are used to maintain the curve list for the active window. Curves can be copied and pasted into other windows. Curves can also be added and deleted from the list.
See the Curve List section of the Define topic for more information on manipulating the curve list.
Referencing Curves
Expressions can reference any curve or vector in the current session. Curve vector references can be defined by picking the curve with the mouse or by using the following syntax:
pmwnco.vector
where:
m is the number of the page on which the curve resides
n is the number of the window which contains the curve
o is the number of the curve in the window
vector is the YM, YP, or "f" when referencing magnitude and phase for complex and polar plot curves.
vector is the YR, YI, or "f" when referencing real and imaginary for complex and polar plot curves.
For example, p2w1c3.ym references the Y magnitude vector (.y) of the third curve (c3), in first window (w1), on the second page (p2).
When a referenced curve is edited or updated, the curves that reference that curve are updated as well.
The Curves dialog allows you to view the curves on a particular page within a session.
Data Sources
Vectors are comprised of Phase, Magnitude, and Frequency vectors. The vectors can be read from a data file, defined as mathematical expressions, or entered as values. The vectors of a curve do not have to come from the same source. For instance, the data source for the Phase and Magnitude vectors of a curve can be an ASCII file and the source for the Frequency vector of the same curve can be defined by an expression such as 0:100:1.
- File as a data source
- The file panel is displayed, allowing you to select data files for the
vectors.
Figure 3. - Math as a data source
- If Math is selected as the source, the curve calculator is displayed, allowing you to define the vector mathematically.
-
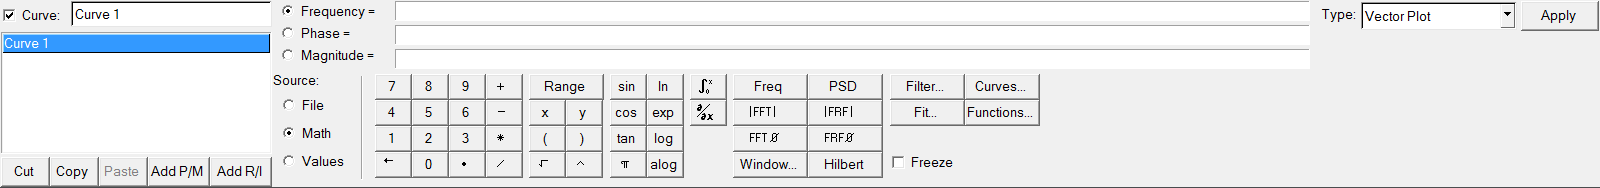
Figure 4. - Values as a data source
- If Values is selected as a data source, a table
is displayed that allows you to directly enter data point values.
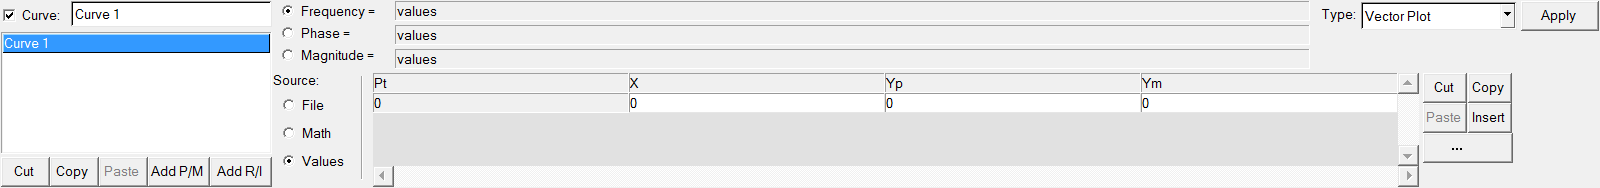
Figure 5. - You can cut, copy, paste, and insert data point values to the table.
Click the expansion button,
 , to view a larger dialog containing all x and y data points.