HV-4010: Performing Advanced Queries
In this tutorial, you will learn how to query results based on a contour value and create sets/groups of the queried entities.
This exercise uses the file truck.key
and the corresponding d3plot file located in the
animation\truck folder.
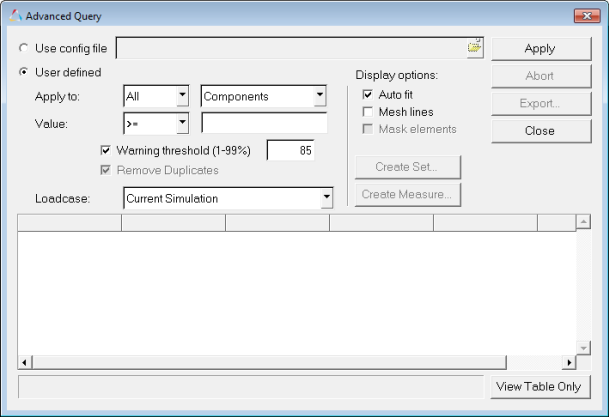
Figure 1. Advanced Query Dialog
The Advanced Query dialog allows you to query components, elements, and nodes based on a value in the legend of an applied contour. This allows you to filter your model to display entities of interest for the contour that you have applied. You can also create sets (groups) of the data that you have queried, thereby preventing the need to query the same data multiple times.
Contour the Model
- Load the truck.key model file and the corresponding d3plot results file, located in the animation\truck folder.
-
Click the Contour panel button
 on the Result toolbar to enter the Contour panel.
- Contour the model for vonMises stresses.
- Click Apply.
-
Animate the model
 .
.
- Stop the animation.
-
Select the Animation Controls panel button
 on the Animation toolbar.
- Use the Current time slider bar to display the time 0.034996.
Using the Advanced Query Dialog to Query Results
-
Click the Query panel button
 on the Result toolbar to enter the Query panel.
-
Verify that Loadcase is set to Current
Simulation.
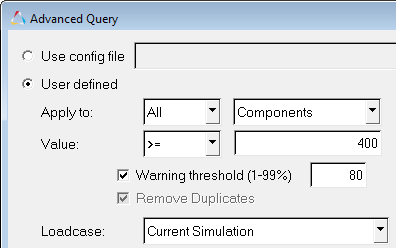
Figure 2. -
Click Apply.
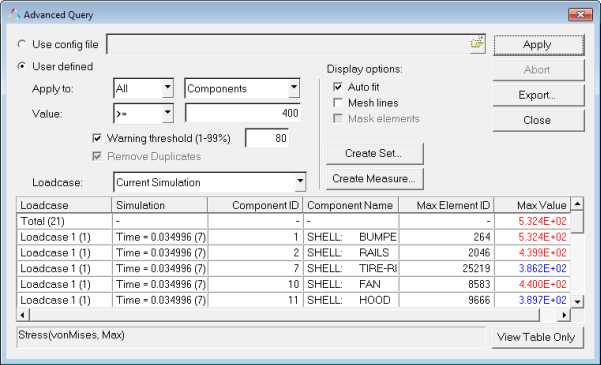
Figure 3.Note: The feature lines are now displayed on the model. -
Click on 5.324E+02, which is the first value located in
the Max Value column.
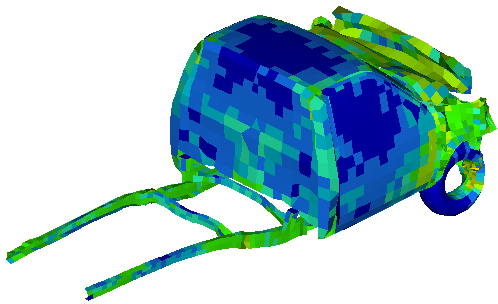
Figure 4. -
Click on other values in the Max Value column, and
observe the graphics area.
The component with the element that has the maximum value that you selected will be displayed.
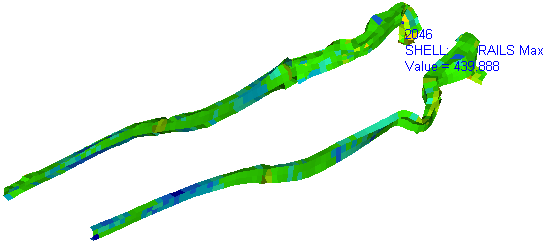
Figure 5.
Creating and Viewing a Set (Group) of Queried Entities
-
Enter vonMises>=400 into the Group label text box.
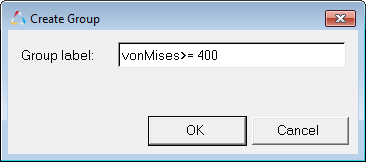
Figure 6.
Using the Advanced Query Dialog to Query Top N Elements
-
Click Apply.
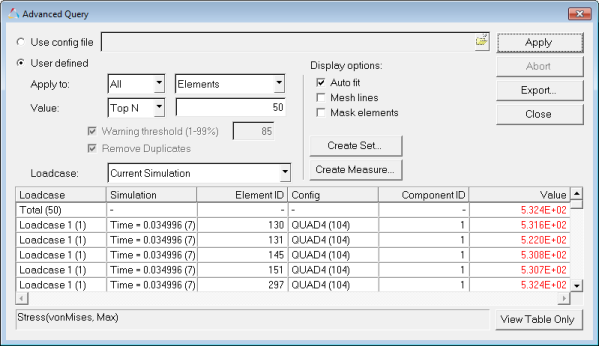
Figure 7.The top 50 elements of the model are shown in the list. -
Turn off the display of all components by clicking
 .
.