Post-process Stress Results (solver independent)
-
From the View Controls toolbar, click
 .
.
-
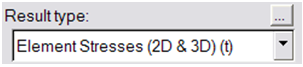
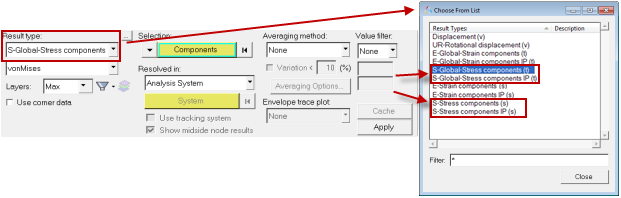
From the Contour panel, select the data type that should be used to calculate
the contours (for example: Displacement (v),
Stress (t), 1D stress,
Energy (s), etc.) from the Result type drop-down
menu.
The available result types change depending on the result file that is loaded.Tip: Click the expansion button
 to open the Choose From List
dialog, where you can filter result types for faster selection.
to open the Choose From List
dialog, where you can filter result types for faster selection. -
If corner data is available, choose if a nodal or element value should be used
by checking/unchecking the Use corner data option (see
the element stress examples below).
Averaging: None Averaging: Simple/Advanced Use corner data off One value per element: centroid value taken from result file. 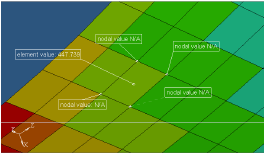
One nodal value for all corresponding elements: averaged from each centroid value. 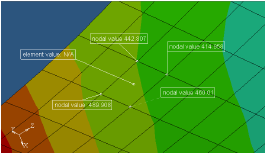
Use corner data on IP value mapped to nearest node, OR, Nodal result from result file (whichever of the two is available): values are not averaged at node. 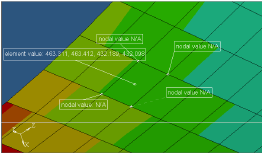
One nodal value for all corresponding elements: averaged using corresponding corner data values (either IP or nodal result from result file). 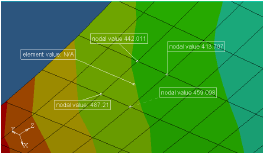
-
Use the Averaging method drop-down menu to select the
averaging type of the element contribution at the shared element node (see the
element stress examples below).
Only one element contoured: Averaging at nodes with values from that element.
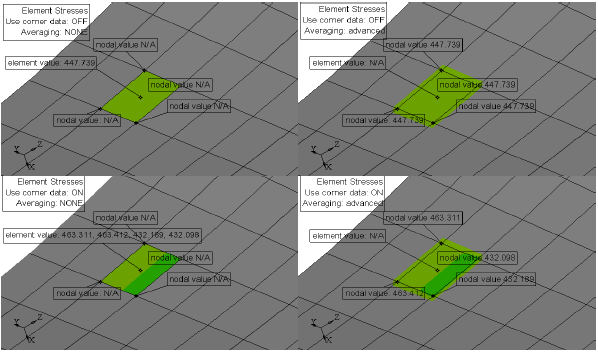
Figure 1.Values that are averaged at nodes have contributions from all of the attached elements.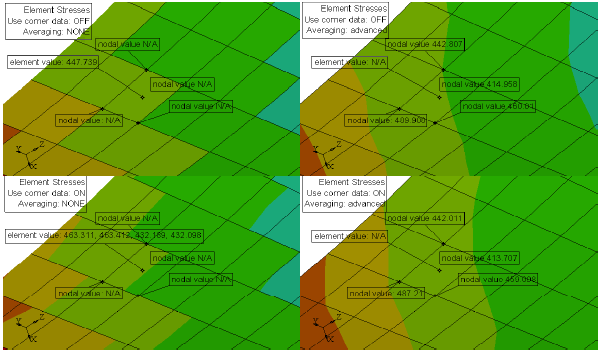
Figure 2. -
Click Apply to display the contour plot.
- For Abaqus .odb files
- The following results are available from *.odb
files:
- Centroid values
- Integration point values: S-Stress component or S-Stress component IP (Integration Points), depending on the result type.
- Nodal results: S-Stress component or S-Stress component IP (Integration Points), depending on the result type.
Averaging: None Averaging: Simple/Advanced Use corner data off One value per element: centroid value taken from result file. One nodal value for all corresponding elements: averaged from each centroid value. Use corner data on IP value mapped to nearest node
(S-Stress Components IP)
OR
Nodal result from result file
(S-Stress Component)
In both cases, values are not averaged at node.
One nodal value for all corresponding elements averaged using corresponding corner data values:
IP value (S-Stress Component IP)
OR
Nodal result (S-Stress Component) from the result file.
- For *.op2 and *.h3d results