HG3D-1020: Data Query
In this tutorial, you will learn how to use the Data Query panel for Waterfall plots, and plot the orders in the HyperGraph window
The Data Query panel can be accessed in one of the following ways:
- Click on Data Query panel icon,

- From the Curves menu, select Data Query
The Data Query panel uses vertical cutting surfaces for viewing and plotting non-planer cross sections. Surfaces can be defined by math expressions, specifying orders, and selecting points on the waterfall plot or 3-D surface plot.
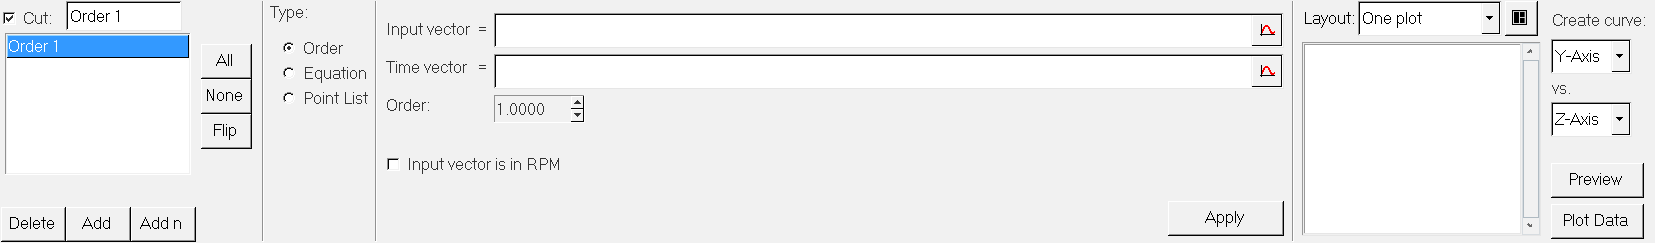
Figure 1.
Open Session File
- From the File menu, click Open.
- Select the file trimmer.mvw, located in the 3dplotting folder, and click Open.
- Click Close on the message log that appears.
-
Click on the Add Page icon,
 , to add a page.
- From the Select Application menu, select HyperGraph 3D.
Create a Frequency versus Time Waterfall Plot
-
Click the Waterfall icon,
 , on the toolbar to enter the panel.
- Verify that Frequency and Time are the options set under Plot Type:.
-
Click the curve selection icon,
 , in the Response Field for Data Curves:.
- Choose the Force vs Time – Raw curve.
- Click Select.
- Verify that the curve referenced under Response is p1w2c1.
- Enter 100 for Number under Waterfall Slices.
- Check the Contour waterfall option.
- Click Apply.
Create Cut Lines Using the Data Query Panel
-
Click the Data Query icon,
 .
.
-
Click OK.
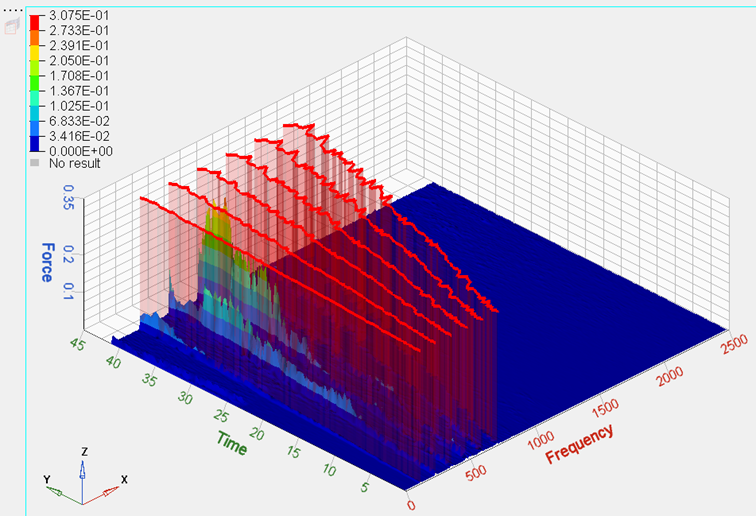 Figure 2.
Plot the Orders in HyperGraph Windows
-
Select the Two-Window Layout,
 , from the layout options in the Data Query panel.
-
Click Apply.
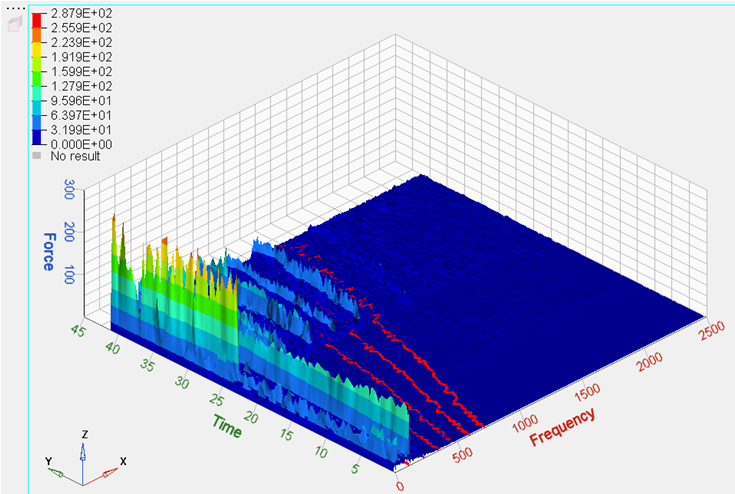 Figure 3. Note: The plots in HyperGraph windows have been updated.
Create a New Order and Position Them
-
Left-click on an order in the Waterfall Plot to set its location.
Note: The location of the new order is shown in the Order list in the panel.
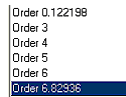 Figure 4.