Coordinate Info
Retrieve individual point data on any curve in the active window. When a point is selected, the point data is displayed on the panel.
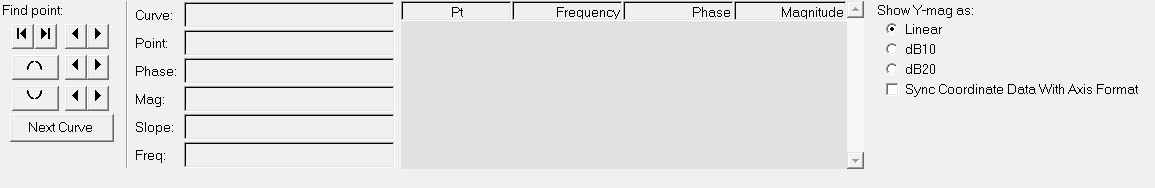
Figure 1. Coordinate Info panel
There are three ways to retrieve point data from a curve. A point can be picked from a curve, located using the Find Point controls, or selected from the point list.
Find Point Controls
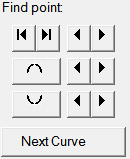
Figure 2.
- Click
- To Find


- The left-most or right-most end point.


- The next point to the left or right.

- Global maximum of the curve across all frequencies of points.
HyperGraph moves the cursor the Max magnitude value which is the maximum value from the center of the polar plot and across all frequencies for vector plots.
- The next local maximum in the previous or next frequencies for vector
plots.
The next or previous local maximum point for phase/magnitude and radar plots.
HyperGraph moves to the next peak with respect to the center of the polar plot.

- The global minimum of the curve across all frequencies or
points.
HyperGraph moves the cursor the minimum magnitude value, which is the minimum value from the center of the polar plot.
- The next local minimum in the previous or next frequencies.
HyperGraph moves to the next peak with respect to the center of the polar plot.
- Next Curve
- The same frequency on the next curve for vector plots.
The same phase on the next curve for phase/magnitude and radar plots.
Point List
The point list displays the phase and magnitude data points for the selected curve. The point number, the phase-value, and the mag-value for each point are displayed in the list. Use the scroll bars to view the entire list. Click on a point in the list to display the point data. For vector plots, frequency is included in the value table.
Point Data
- Curve
- The name of the curve.
- Point
- The number of the data point.
- Theta
- The theta value of the data point.
- r
- The r value of the data point.
- Slope
- An estimate of the slope of the curve at the selected point.
- Freq
- The current animation time step (frequency) and not the frequency of the picked point.
Display Point Data
- Linear
- db10, to display data in decibels
- db20, to display data in decibels
Select Sync Coordinate Data with Axis Format to show coordinate info curve values in the same format (scientific, fixed) as used by the axis. See the Axes panel for more information on defining the axes.