View the near field results in the 3D view and add a legend and
contours.
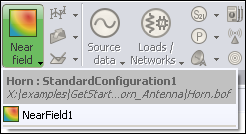
Add the near field data to the 3D view.
-
On the Home tab, in the
Add results group, click the
 Near field icon. From the drop-down list, select
NearField1.
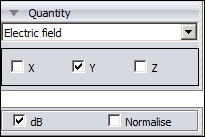
View the electric field in dB.
-
On the result palette, in the quantity panel,
select the dB check box.
For the purposes of this example, the magnitude of the Ey
component of the field is to be displayed.
-
On the result palette, in the quantity panel,
clear the X check box and the
Z check box.
Add a legend to the 3D view (top left).
-
On the 3D View
contextual tabs set, on the Display tab, in the
Legends group, click the
 Top left icon. From the drop-down list select
NearFields.
Add contours to the near field result.
-
On the 3D View
contextual tabs set, on the Result tab, on the
Contours group, click the
 Show contours icon.
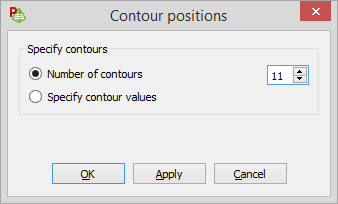
Specify the number of contours for the near field.
-
On the 3D View
contextual tabs set, on the Result tab, in the
Contours group, click the
 Position icon. Click Number of contours and set its value to
11.


