Legend
ProMan's legend for result data consists of three sections - company logo, scale and status field.
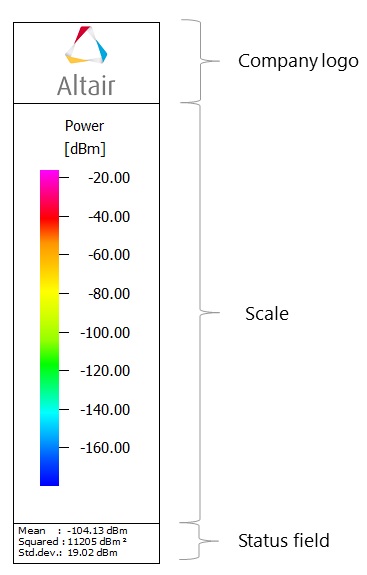
Figure 1. Example of a legend.
In the upper part of the legend an arbitrary company logo can be shown. The bitmap file for the company logo can be loaded via context menu, which is available by right click on the legend. In the middle the scale of the result data is shown. The scale of a result is automatically set depending on the result type.
Nevertheless, all settings corresponding to the scale, such as color palette, value range and type can be specified by the user as well. The status field of the legend contains additional information like file name, statistical information or the prediction height of the result. The status field is optional and can be hidden.
The legend can be enabled or disabled. Click and select the Layout tab on the Display settings dialog.
On the Legend tab you can enable / disable the company log and specify the information contained in the status field.
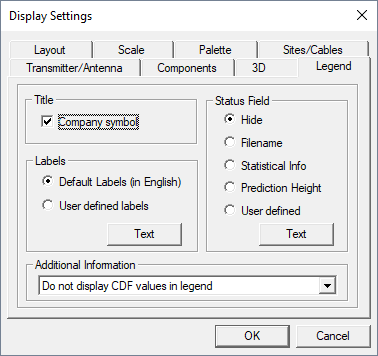
Figure 2. The Display Settings dialog.
- Title
- Enable or disable the company logo.
- Labels
- You can select either default labels in English or arbitrary user-defined labels. If the User defined tab is selected, the legend texts can be edited by pressing the Text button.
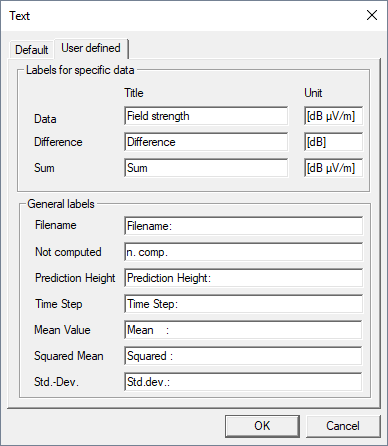
Figure 3. The legend Text dialog.
- Status Field
- The status field in the lower part of the legend can contain different additional information, such as the file name of the result or statistical information. Optionally, three lines of arbitrary user-defined text can be displayed.
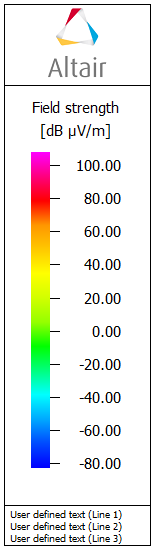
Figure 4. A legend with user-defined text.
User-defined text can be edited by pressing the Text button. Besides the text contained in the three lines, also the size of the font can be specified.
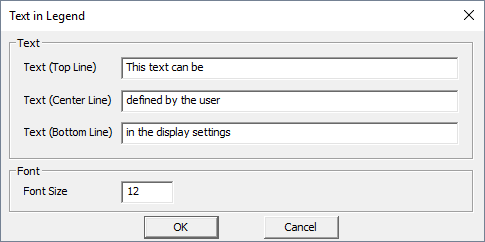
Figure 5. The Text in Legend dialog.
- Additional Information
- Optionally, the cumulative distribution function (CDF) or 100% - CDF of the data can be displayed on the left side of the scale. The displayed CDF values consider all predicted pixels of the current data, including all height layers and prediction planes. This allow you to analyze which coverage percentage is reached above a certain threshold.
All settings related to the legend can be specified also using the legend context menu by right-clicking on the legend.
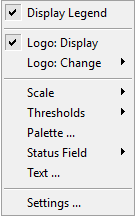
Figure 6. The context menu for legend.