Viewing the Prediction Results
Display the field strength results using the COST 231 - extended Walfisch-Ikegami model.
-
View the field strength using the COST 231 - extended Walfisch-Ikegami model in the
urban environment.
-
In the tree, expand
 Results: Propagation to view site 1.
-
In the tree, expand
 Site 1 to view the three antennas.
-
In the tree, expand
 Site 1 Antenna 3 to view the Field
Strength and Power entries.
Site 1 Antenna 3 to view the Field
Strength and Power entries.
-
In the tree, click
 Power to view the results.
-
Right-click on the legend and from the right-click context menu, click .
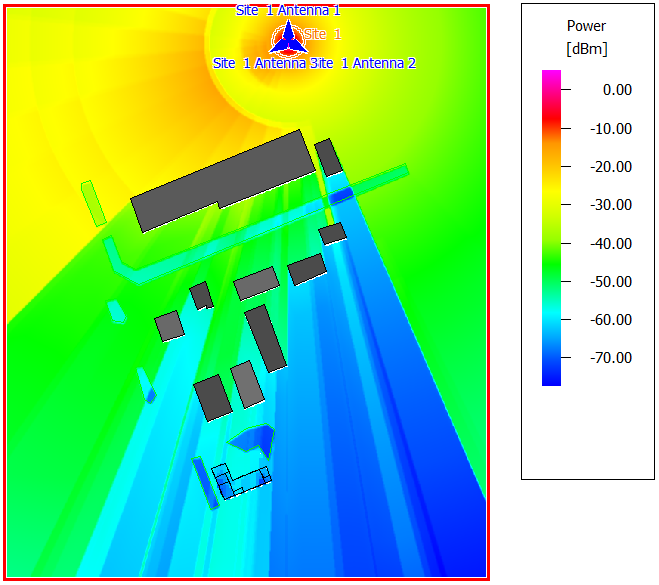
Figure 1. Power calculated using the COST 231 - extended Walfisch-Ikegami model.
-
In the tree, expand
-
View the power for the indoor database.
- Zoom in on the indoor database.
- Right-click on the legend and from the right-click context menu, click .
- In the Max field, enter a value of -50 dBm.
- In the Min field. enter a value of -90 dBm.
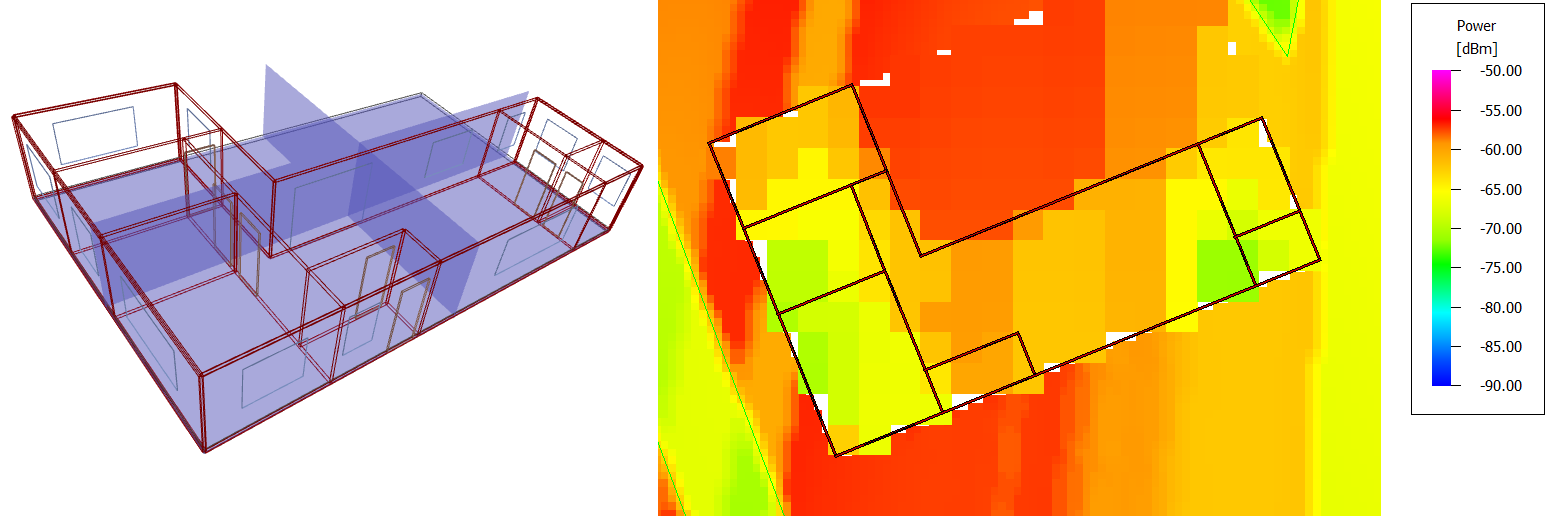
Figure 2. Power calculated using the COST 231 - extended Walfisch-Ikegami model for the indoor database.Note:- Propagation is along straight lines only (always in the vertical plane between transmitter and point of interest).
- The power is lower than with the dominant path model.
- Effects of windows and doors are visible.