


|
Adding Columns to the Breakdown
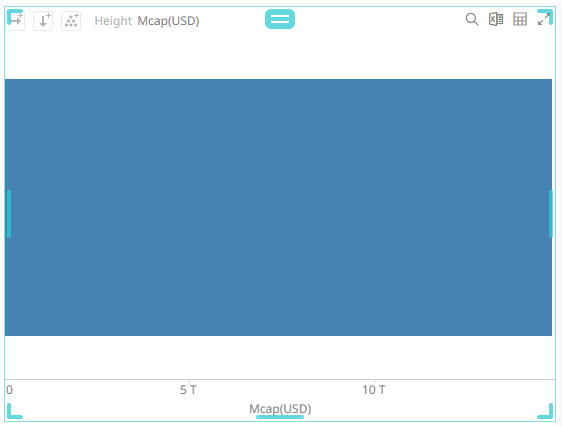
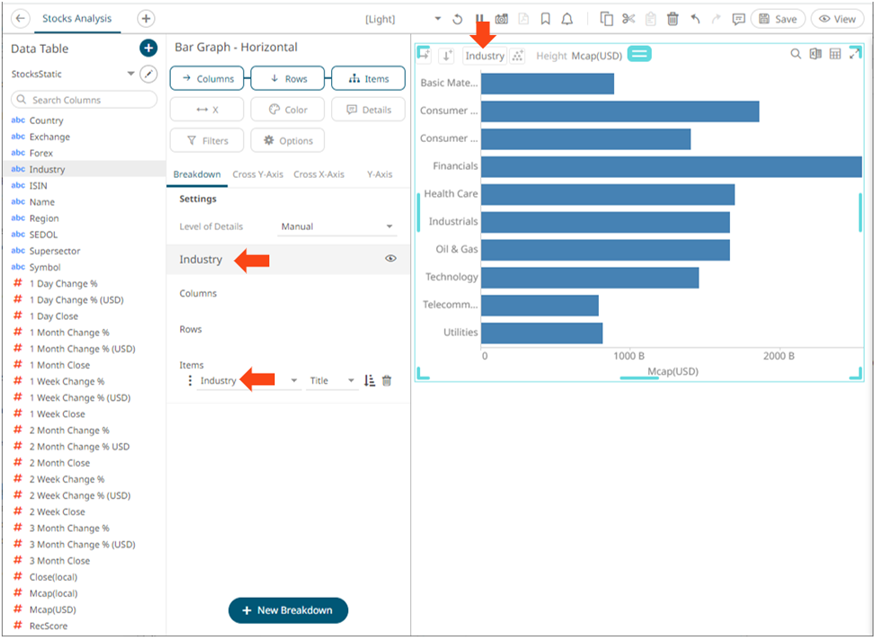
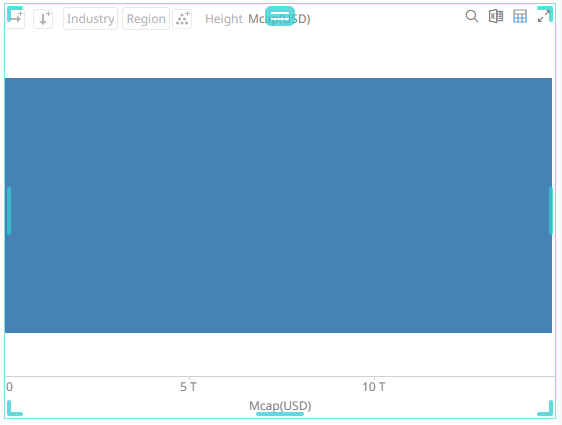
A Bar Graph without a breakdown (Empty) will show a single bar.
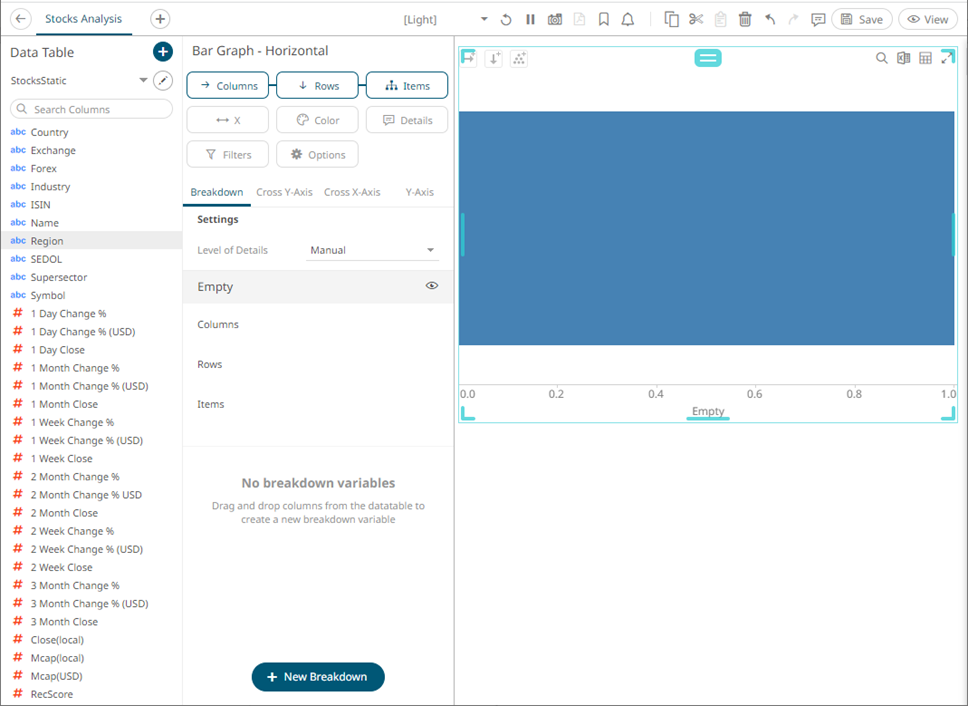
Note that in this sample visualization, there is a column (Mcap (USD)) dragged and dropped to the X variable.
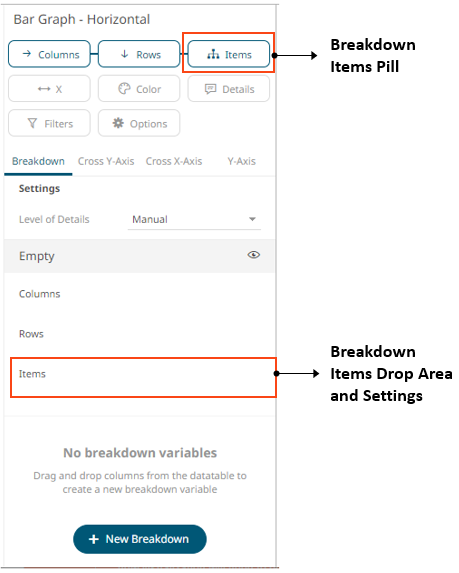
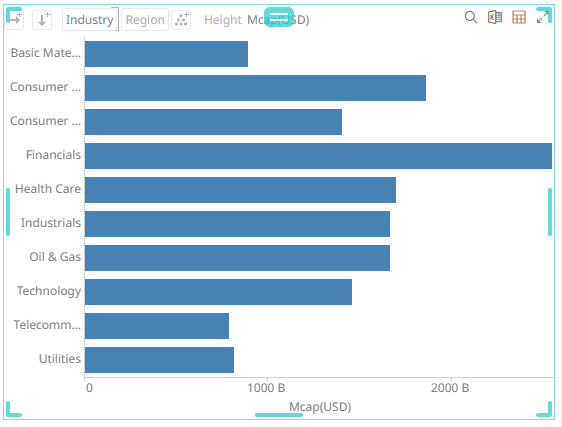
To add items to the breakdown, drag text columns from the Data Table pane to the Items variable or Items drop area under the Breakdown tab.
For example:
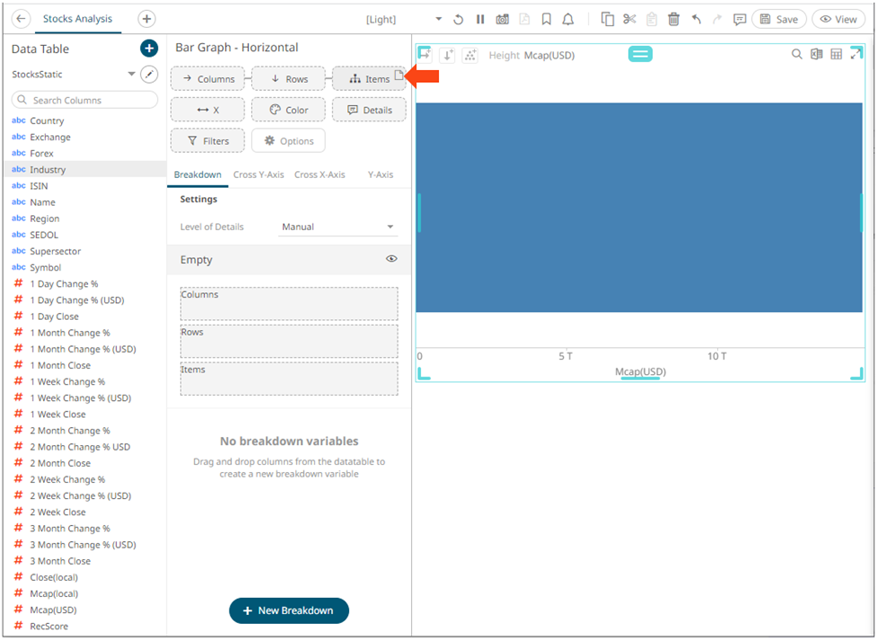
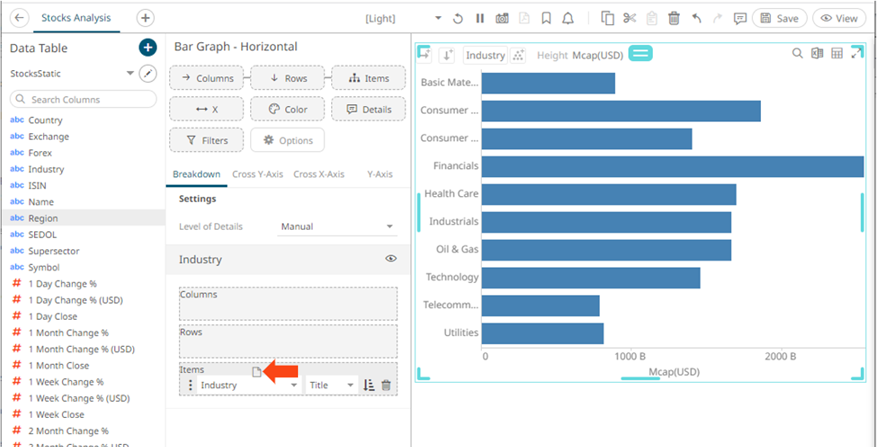
Note that the other controls where you can drop the dragged Text column are highlighted as well (X, Color, Details, Filters, Columns, Rows).
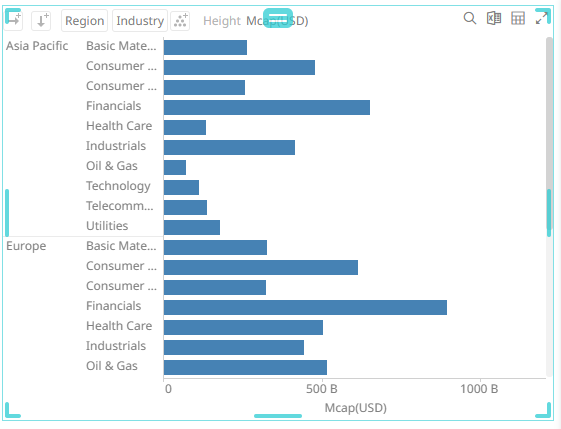
After dragging a data column to a breakdown, this will break apart the aggregated data into separate bars and the column is added under the Items drop area of the Breakdown tab and Breakdown section of the visualization. Also, the dragged column will replace the Empty state name.
You can opt to drag more columns into the current breakdown.
This will produce a multi-level hierarchy and the new column is added to the breakdown.
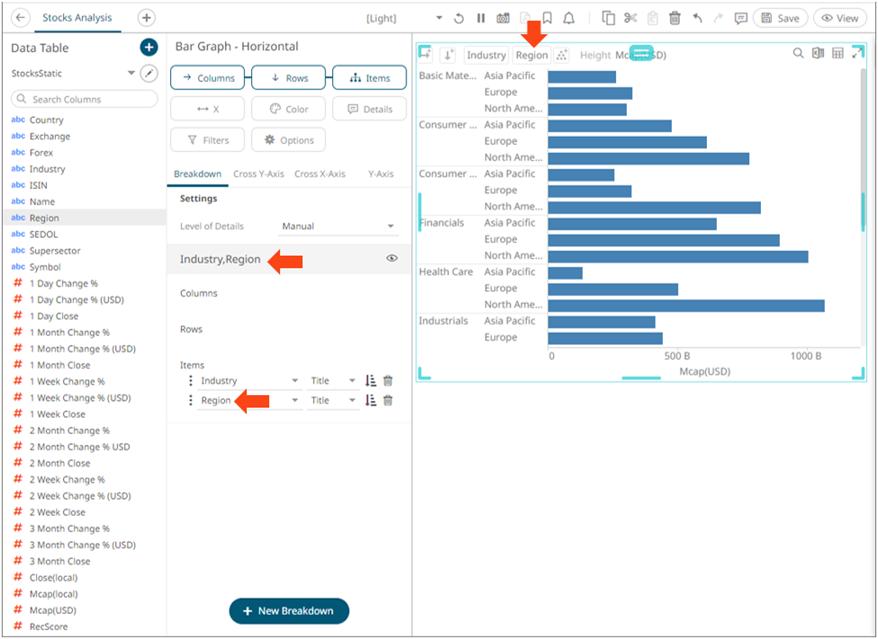
If the column has been dropped into the incorrect position, simply click and drag the column to the correct position in the visualization.
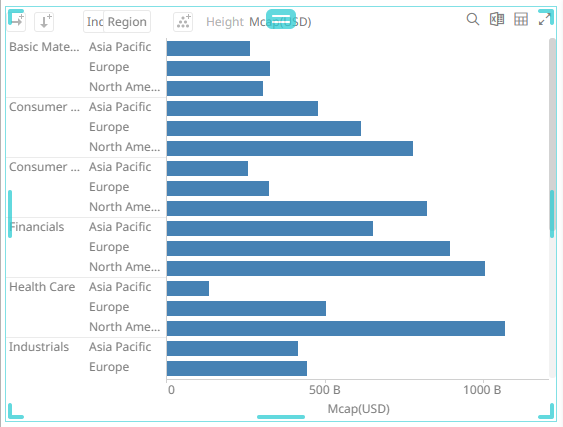
The visible detail level of the multi-level hierarchy can be adjusted by clicking on the breakdown column itself.
This will grey out the hierarchy level.
Clicking on the breakdown column will update the display to show the level of detail again.
On the Visualization Settings pane, you can also perform the following:
q Modify the breakdown columns
q Sort the visualization for each level of the breakdown
q Sort the visualization based on the breakdown column values
q Add more breakdowns
q Select the breakdown to use
q Delete a breakdown column