


|
Details Variable Configuration
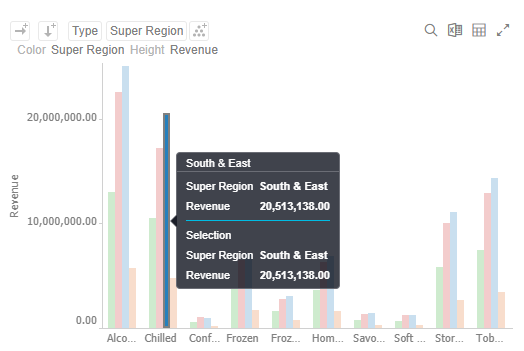
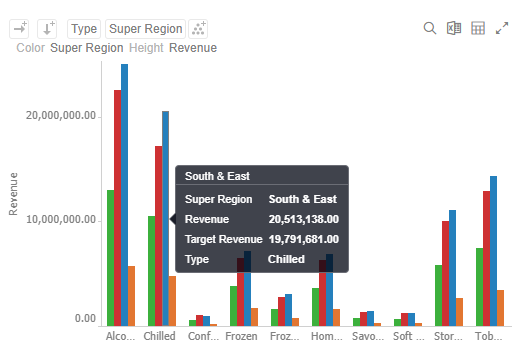
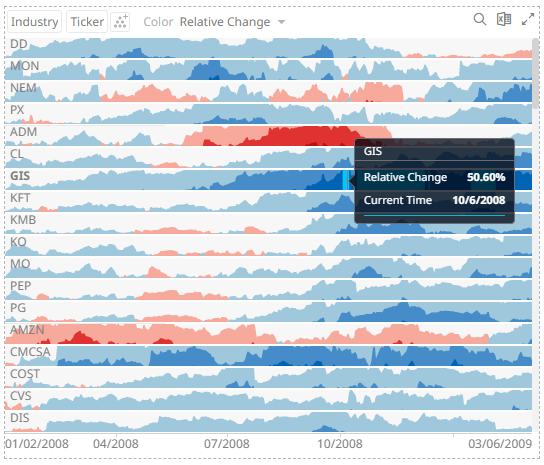
The Details variable controls the information that appears on the pop-up when hovering over a specific item within a visualization. It also controls the information available for export from the visualization.
You can also control whether the following items are displayed or hidden in the Details pop-up:
q Other visualization variables, including Size, Height, X, Y, Color, and Icon variables
q Time (Current Time period for a Time Series visualization)
q Additional variables specifically added to appear in the Details pop-up
Steps:
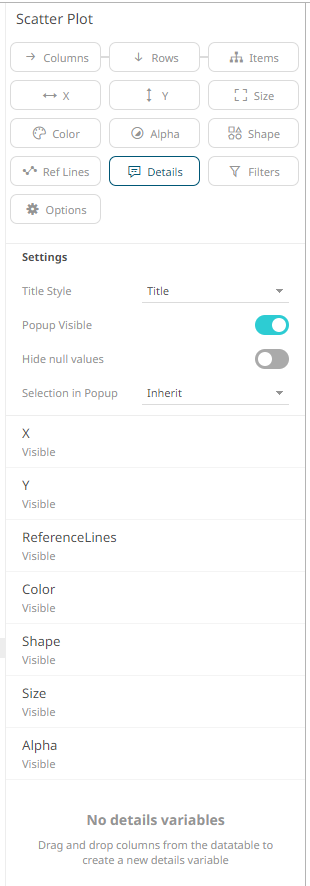
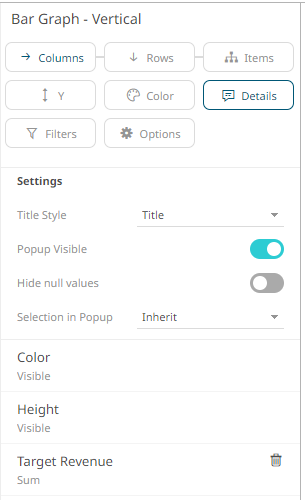
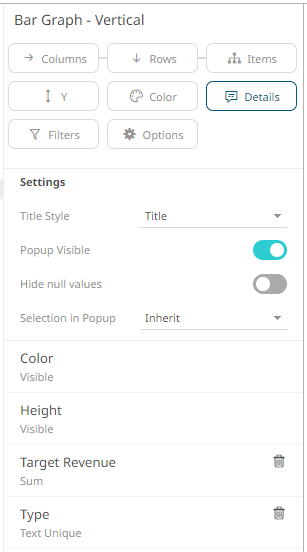
1. Click on the Details button of a visualization. The Details Settings pane displays along with the available variables of the visualization.
Sample 1: Scatter Plot visualization has HeightX, HeightY, Size, Color, Alpha, Shape, and Reference Lines variables.
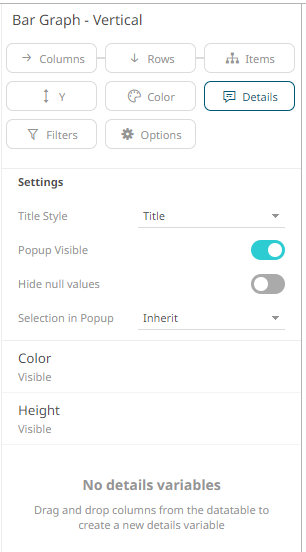
Sample 2: Bar Graph – Vertical visualization has HeightY and Color variables.
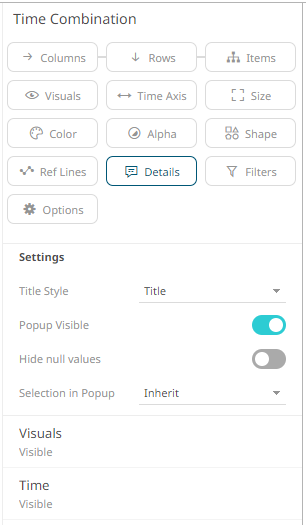
Sample 3: Time Combination visualization has Visuals and Time variables.
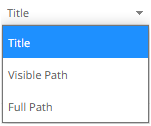
2. Select the Title Style: Title, Visible Path, or Full Path.
3. By default, Popup Visible is enabled to display the Details pop-up. Tap the slider to turn it off.
4. Tap the Hide Null Values slider to turn it on.
5. Select the Selection in Popup:
· On
The Details pop-up of the selection in the visualization is displayed.
· Off
The selection in the Details pop-up is turned off.
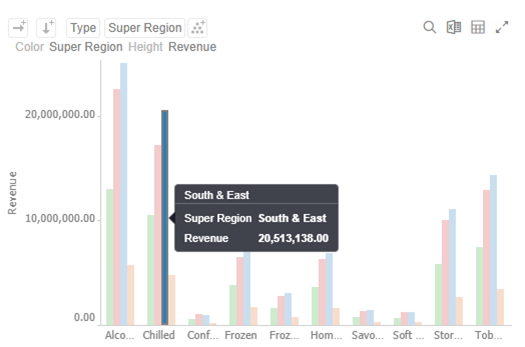
· Inherit
The selection option in the Details pop-up is inherited from the workbook properties.
6. You can also drag and drop numeric columns from the Data
Table pane to the Details  button or
on the Details pane. .
button or
on the Details pane. .
The column is added under the Details pane.
7. Click on the column to display the configuration pane.
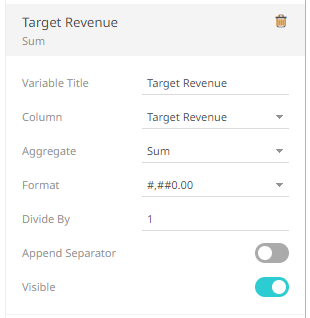
8. Enter the label of the Details variable in the Variable Title field.
You can parameterize the variable title to support dynamic schema in the dashboards.
9. You can opt to change the column to the be used from the Column drop-down list.
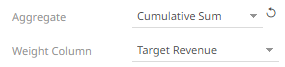
10. Specify an aggregation method in the Aggregate field.
The default is Sum.
· If you set the aggregation method to Cumulative Sum, Cumulative Sum by Max, Intercept, Percent of Total Change, Percent of Weight Parent, Percent of Weight Total, Ratio, Slope, Weighted Harmonic Mean, Weighted Mean, or Weighted Sum, the Weight Column drop-down list is enabled and displays a list of numeric data columns in the selected data table that can be used as the weight column for the aggregate.
· If you set the aggregation method to Percentile, the Percentile field is displayed. Specify the value that can be used to calculate the value of the selected percentile.
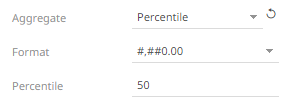
11. The Format field lets you specify the format that numbers will be displayed in. Panopticon uses the same formatting rules as Excel.
12. Select the Divide By value to divide a number:
· 1
· 1000 (by a thousand)
· 10000
· 1000000 (by a million)
· 1000000000 (by a billion)
13. You can also drag and drop text columns from the Data
Table pane to the Details  button or
on the Details pane. .
button or
on the Details pane. .
The column is added under the Details pane.
14. Click on the column to display the configuration pane.
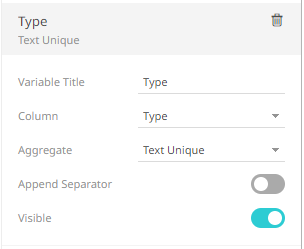
15. Enter the label of the Details variable in the Variable Title field.
You can parameterize the variable title to support dynamic schema in the dashboards.
16. You can also change the column to the be used from the Column drop-down list.
17. Select the text aggregation method from the Aggregate field: Count Distinct, Text Unique, or Text Concat Distinct.
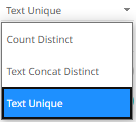
The default is Text Unique.
18. The Format field lets you specify the format that the text will be displayed in. Panopticon uses the same formatting rules as Excel.
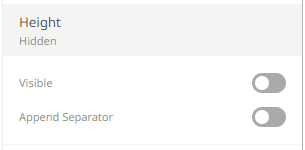
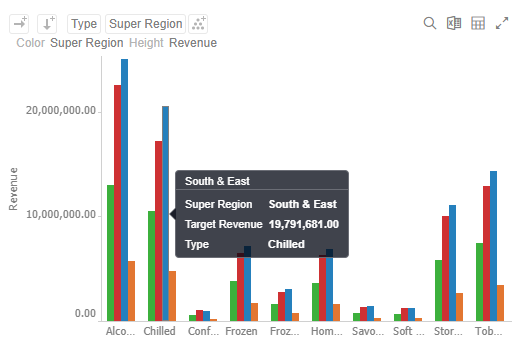
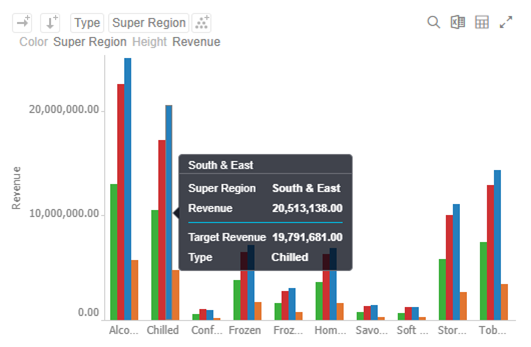
19. By default, all of the variables are set to be Visible on the Details pop-up.
For example, when the Height variable column is Revenue and set to Visible, the value of Revenue is displayed in the Details pop-up.
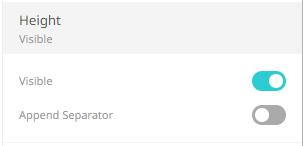
Tap the Visible slider to turn it off so the variable detail will not be displayed.
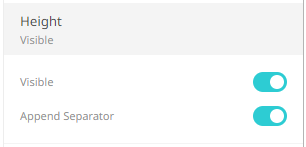
20. Tap the Append Separator slider to display the separator of the values.
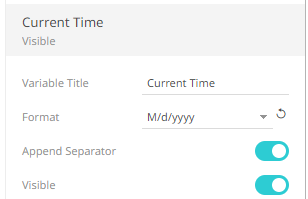
21. For time series visualizations, you can set the current time period that will be displayed on the Details pop-up. Othewise, skip to step 22.
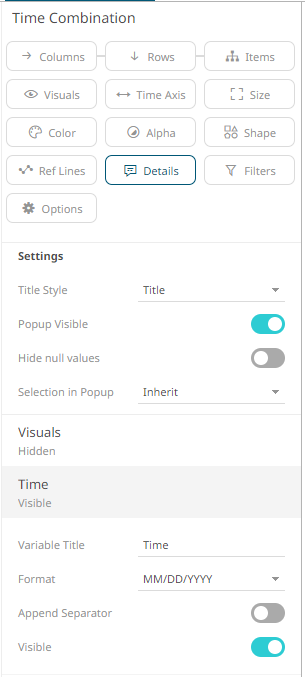
Set the Variable Title and the Format.
For example:
22. Click the Save  icon on the toolbar.
When saved, the  notification
is displayed.
notification
is displayed.