Doppler Spectrum
This option allows the user to see a 2D graph of the field values for each frequency of the Doppler frequency Spectrum Shift. The frequency scale is relative to the carrier frequency, that means that a 0.0 frequency shift is for a signal that does not suffer any frequency shift (it frequency is exactly the carrier frequency).
To plot a graph, the user can select the field component, the polarization, the step, the carrier frequency and the Doppler Period (). A new graph will be plotted with the button ' Add Series'. In the case that the user has set up a parametrized geometry (see GUI for details), it is possible to select the step to visualize the results for.
It is also possible to delete a series that is selected by the user from the list with the 'Remove Series'. The display option also allows changing the color of the series and display points. The buttons ' Import Series' and ' Export Series' are used for importing and exporting the selected series in 'List of Series' to a data file written as a text file.
This panel displays a plot with the results, and several options for adding and removing extra series from the plot.
When initially open, the panel will display a default series in the plot that will represent the measurements for a particular component, polarization and step. More series can be added, by selecting component, polarization and step that appears leftside to the plot.
- Component: select the Cartesian component of the field to visualize the results. The enabled options are Ex, Ey, Ez and ETotal.
- Polarization: select the polarization component of the wave to visualize the results. Select one of the possible values Vertical, Horizontal. If the source has been defined as a radiation pattern, this combo box will not be available.
- Step: select the simulation scene to visualize the results. These should have been defined prior to the calculation when designing the simulation.
- Frequency select the simulation frequency (as the carrier frequency) to visualize the results.
- Period select the simulation Doppler period (Only will be enabled if Doppler FMCW option is selected on Doppler parameters) to visualize the results.
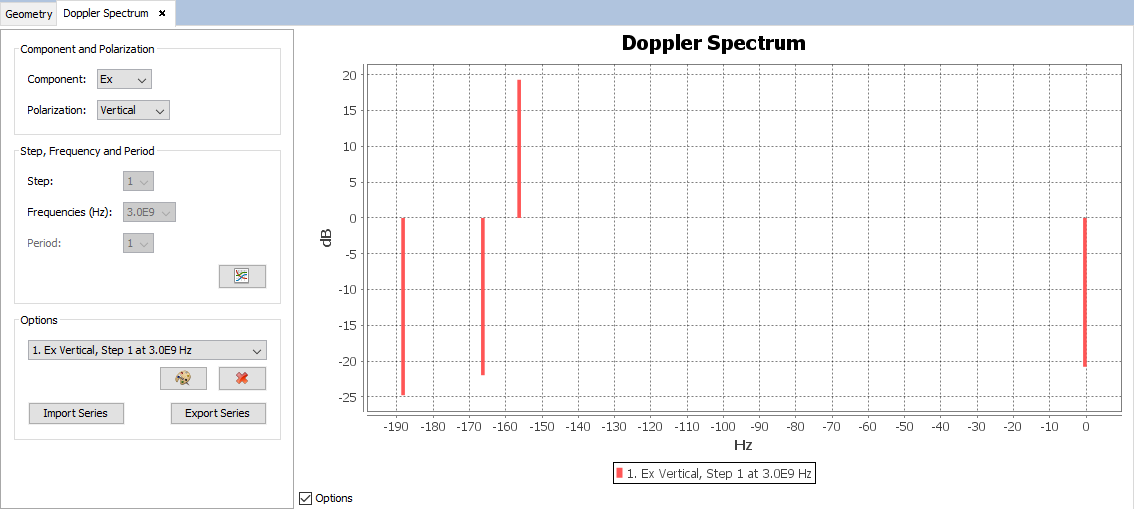
Figure 1. Doppler Spectrum panel