Interpretation of Topology Optimization Results
Topology optimization results are interpreted to provide an iso-density surface based on the volumetric density information of a topology optimization, which is conducted using OptiStruct.
#general parameters
input_file            mattel
output_file           mattel.stl
output_code           3

#specific parameters
isosurface            1  3  0.300
laplacian_smoothing   10  30.000  1
surface_reduction     1  10.000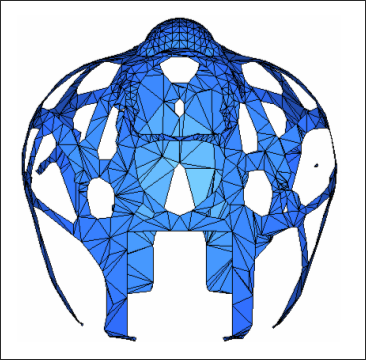
Figure 2. Surface Reconstruction of Shell Element Topology Optimization
The parameter laplacian_smoothing is used for additional smoothing. In most cases, the threshold surface (isosurface with second argument 0) already creates a smooth shape. Additional smoothing (isosurface with second argument 3) maintains the topology as suggested by OptiStruct, but it can deviate from the given density distribution. If this option is used, the maximum and average smoothing error output by OSSmooth should be checked. The surface_reduction parameter is used to reduce the number of elements.
Connection Detection
While the iso-density surface is very useful in visualizing the resulting topology, simply using a density threshold value for design interpretation can be misleading. This is due to the fact that when a density threshold value is defined as the cut-off, all design elements with density values less than the threshold are not considered in the interpreted design. This is the intent of the feature, but in many cases, there are elements with densities lower than the threshold value that do contribute significantly to the structural integrity of the design. Ignoring these sections could lead to design failures or an interpreted design that is infeasible. Therefore, it is very important that these significant lower-density regions be captured as well in the design interpretation process. These regions could be interpreted as thinner or weaker sections, but are necessary from a structural perspective nonetheless. The iso-surface design interpretation capability of OSSmooth was therefore enhanced through the implementation of the connection detection feature.
Once the density threshold is applied, certain strategies are used to detect areas with potential connections or bridges between regions of material to preserve structural integrity of the interpreted design. However, there may be many such potential connections, most of which typically have elements with very low densities. Therefore, a lower bound threshold value can be defined to avoid finding the unnecessary connections.
Both threshold value (T) and lower threshold value (t) refer to element density, and range from 0.0 to 1.0. The lower threshold value, t, should be smaller than the threshold value, T, defined. For example, if T is 0.3, the lower threshold value should lie between 0.0 and 0.3. The default value for the lower threshold is calculated internally as t=0.667*T. However, selection of this value is model-dependant, so when necessary you can override the default by setting the lower threshold value based on your requirements.
If the resulting iso-surface with default settings has unwanted connections, a larger lower threshold value can simply be defined. On the other hand, if the final iso-surface does not contain the important connections needed, the lower threshold value can be made smaller.
Connection detection was implemented to facilitate a more robust design interpretation process by capturing important material distribution that could otherwise be missed due to the definition of a single density cut-off value.
From Figure 3 and Figure 4, it is evident that by selecting a certain threshold value, certain critical structural members may be lost in the design interpretation process.
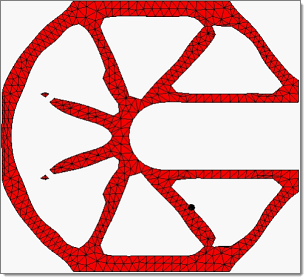
Figure 3. Density Threshold = 0.5
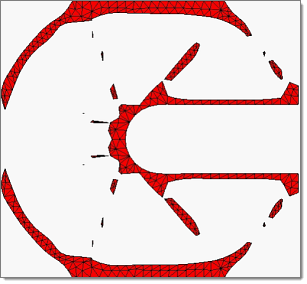
Figure 4. Density Threshold = 0.7
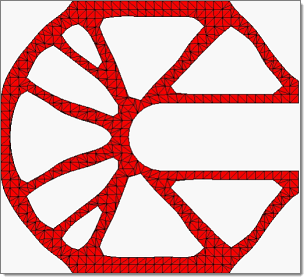
Figure 5. Connection Detection = 0.5
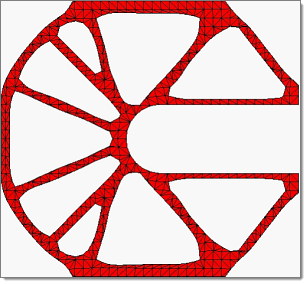
Figure 6. Connection Detection = 0.7
Draw Recovery
To further enhance the quality of recovered geometry from a topology optimization, a new draw recovery option is implemented. By simply selecting the draw recovery checkbox in the OSSmooth panel, the draw recovery option is enabled in the geometry extraction process. A draw direction can be defined in the optimization formulation as a manufacturing constraint and the draw recovery option uses this information in the interpretation of the geometry.
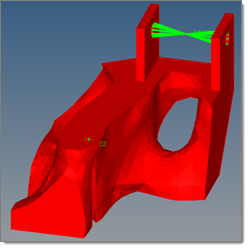
Figure 7. No Draw Recovery
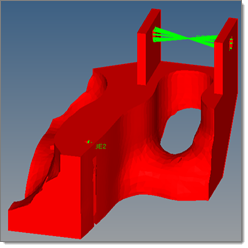
Figure 8. With Draw Recovery