Panel Plot Visualization Options
Define visualization options for the panel plot.
- Evaluate by
- Select what type of data must be shown.
- Create Envelope
- Activate the checkbox to create an envelope using multiple loadcases.
- Normal Loads
- Activate the checkbox to show normal forces.
- Tangential Loads
- Activate the checkbox to show tangential forces (shear forces).
- Show values
- Activate the checkbox to display values.
- Tolerance
- Loads with an absolute value lower than the tolerance are not displayed.
- Arrow Length (%)
- Scales panel plot vectors for visualization.
- Color
- Change the color of normal and tangential loads.
- Normal Load at
- Select if the normal load will be shown at the center or at the corner of element edges.
- Numeric format
- Defines the numeric format of the values shown.
- Tables
- Creates tables with normal and tangential loads for one or multiple panels and for one or multiple loadcases.
- The summary table shows all normal and tangential loads for panel
entities.
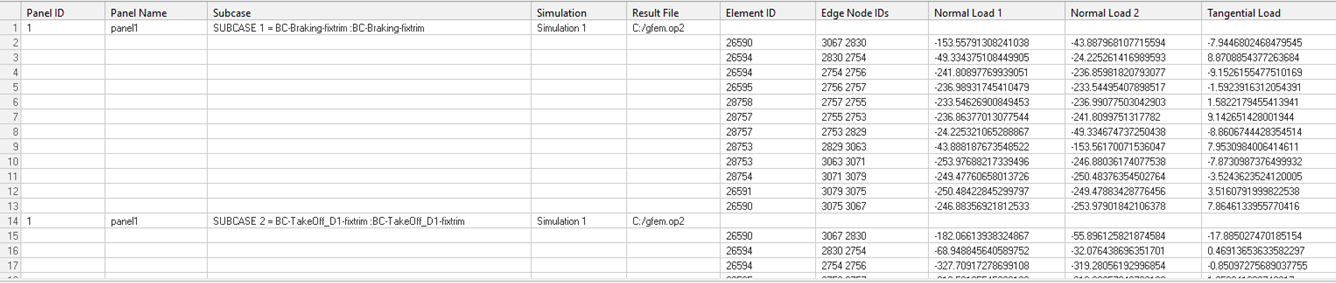
Figure 1. - The min/max table shows minimum and maximum values for normal and tangential
loads.
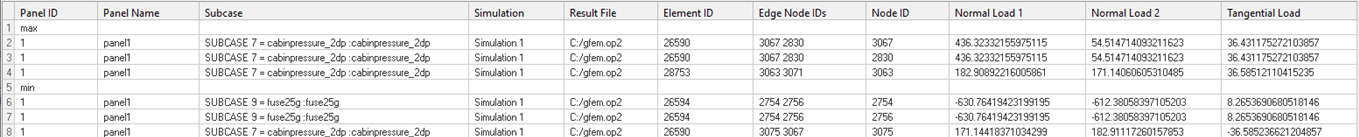
Figure 2.