Contour/Transient Animation
Flow Simulator provides convenience to the users through Contour and Transient Animation options. Users can see the results of their model analysis on the Flow model as colored contours or as a time animation for transient analysis.
Contour and Transient Animation features can be found under PostProcessing section.
![]()
How to Colorize the Results on Flow Simulator
The Coloring option can be found under the Contour / Transient Animation window. Users can colorize either Initial data or Result Data in Flow Simulator.
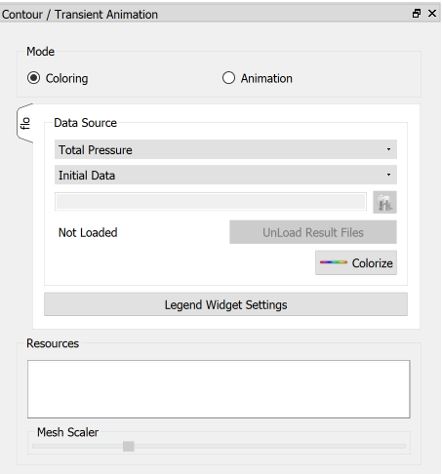
Step 1: First load results from FileàLoad Result File
Step 2: Select object property to be colorized
Step 3: Select data (Initial Data or Result Data)
Step 4: Colorize
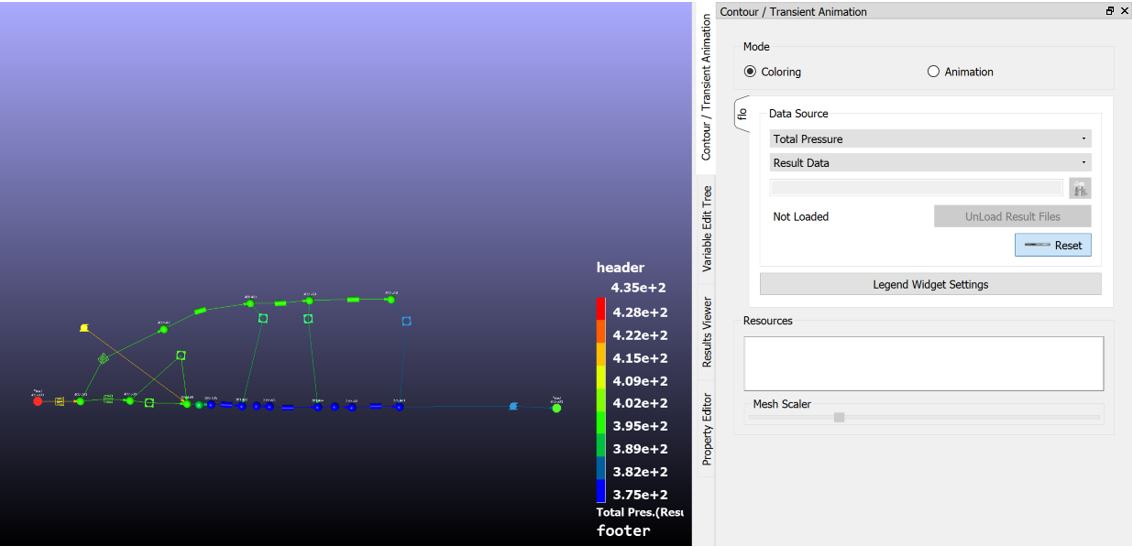
How to do a Transient Animation of the Results on Flow Simulator
In order to see how the results, change with time, Flow Simulator enables Animation feature. Therefore, users do not need additional post processing tool.
![]()
Step 1: Load the transient results by selecting the folder

Step 2: Select object property to be colorized
Step 3: Select data (Initial Data or Result Data)
Step 4: Define animation speed by moving the bar between Slow and Fast
Step 5: Play
Legend Widget Settings
Legend Widget Settings can be accessible both for Coloring and Animation features. Users are able to modify the settings.
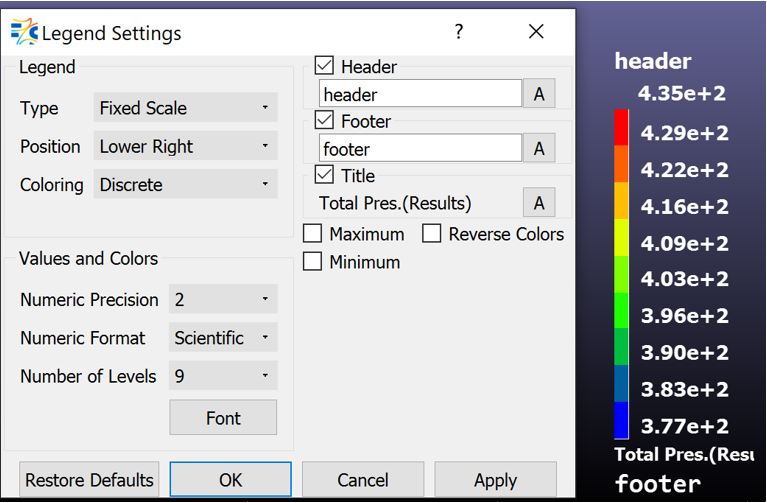
| Type |
Fixed Scale Displays a global maximum and minimum value in the legend for the time steps FlowSimulator has already processed. Dynamic Scale Changes the legend with respect to the maximum and minimum values of each time step or simulation. |
| Position | Select the position of the legend within the FlowSimulator window (Upper left, Upper right, Lower left, or Lower right). |
| Coloring type | Currently Only Discrete Colour Patterns Options are supported. |
| Numeric Precision | You can increment the current value from 1 to 12 decimal points |
| Numeric Format |
Scientific: Displays the values in scientific format. Fixed: Displays the values in a fixed format. |
| Number of Levels | Displays more or less contour bands along with their respective ranges. The minimum number of bands you can display in a legend is 2; the maximum is 32. |
| Font | |
| Header & Footer | Displays the legend Header/Footer. To remove the Header/Footer, deactivate the check box. To enter a new footer, highlight the existing text, type in a new Header/Footer and click Apply. |
| Title | Displays the title of the legend. The title reflects the settings used to generate the contour and cannot be changed. Click the font button, to change the font style and size |
| Maximum/ Minimum | Displays the maximum and minimum legend values. Deselect the option to remove the minimum and maximum values from the display. |
| Reverse Colors | Reverses the legend values assigned to the contour bands. |