Layout Tab - Display of Results
Layout Options
On this dialog, you can specify how result data and databases are displayed in 2D and 3D views of ProMan.
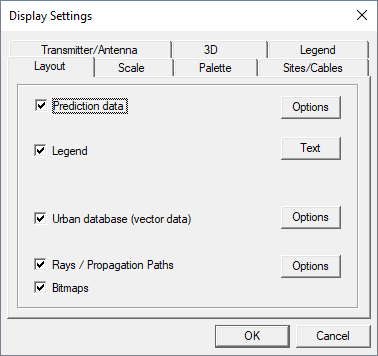
Figure 1. The Display Settings dialog, Layout tab.
Note: The options are only visible if the data is present in the current project.
- Prediction Data
- The predicted data of the opened result can be hidden by disabling the option Prediction data.
- Legend
- The legend corresponding to a result or a database can be hidden by disabling the option Legend. Click the Text button to open a dialog, where texts located within the legend can be edited.
- Topography database (DEM)
- In case the project contains a topography database, it can be hidden by disabling the option Topography database (DEM). By clicking on the Options button, the following dialog will be displayed.
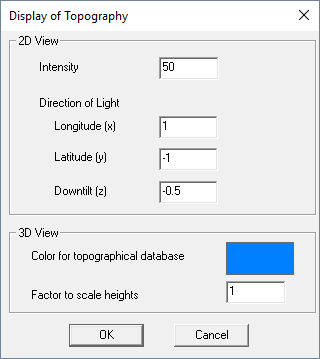
Figure 2. The Display of Topography dialog.
For the 2D view, the light intensity (in percent), as well as the direction of light (x, y, z-direction), can be specified. For the 3D view, the color of the topography database can be changed by clicking within the colored region on the right side of the dialog. Additionally, a scale factor for the heights can be chosen here as well.
- Urban database (vector data)
- In case the project contains an urban building database (vector data), it can be hidden by disabling the Urban database (vector data) option . By clicking on the Options button, the following dialog, which offers further display options for urban vector databases, will be displayed.
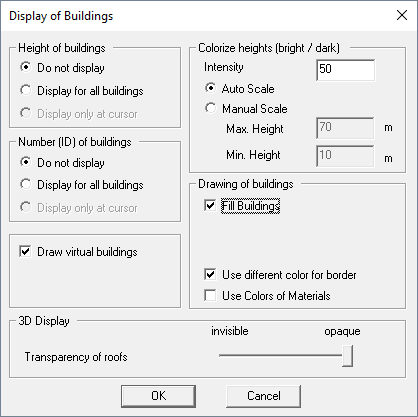
Figure 3. The Display of Buildings dialog.
-
- Height of Buildings
- Display heights of all buildings contained in the database.
- Number (ID) of buildings
- Display number/ID of all buildings contained in the database.
- Draw virtual buildings
- Special object types, such as virtual buildings, vegetation blocks or the shape of CNP buildings can be enabled or disabled to be displayed independently.
- Colorize heights (bright/dark)
- The height of the individual buildings is represented by the color intensity used for drawing the object. The specified intensity can be either auto-scaled according to the building heights contained in the database or adjusted manually with a user-defined scale.
- Drawing of buildings
- Objects can be displayed either filled or in wire frame mode. This option can be specified independently for standard buildings, CNP buildings and vegetation objects. Besides this, vector objects can be drawn using the color of the assigned material or the corresponding default color of the object type
- 3D display
- The transparency of the roofs can be chosen arbitrarily. This makes it possible to see prediction results within the buildings.
- Indoor database
- In case the project contains an indoor database (vector data), it can be hidden by disabling the option “Indoor database”. By clicking on the Options button, the following dialog, which offers further display options for indoor vector databases, will be displayed.
-
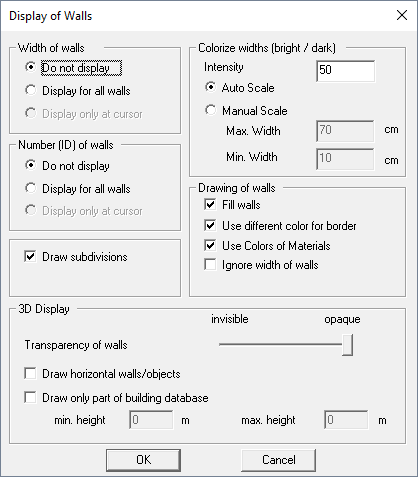
Figure 4. The Display of Walls dialog.
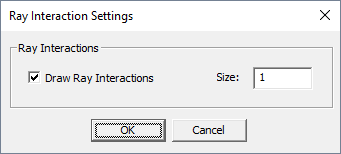
Figure 5. The Ray Interaction Settings dialog.
- Bitmaps
- If the project contains background images, you can display or hide them by selecting or clearing the option Bitmaps.