3D Tab
View the 3D tab.
Display Results in 3D View
Simulation results including ray data and topographical database (if available) can be displayed three dimensional with ProMan. This option is available at or by selecting the corresponding toolbar icon. Options related to the 3D display can be specified at .
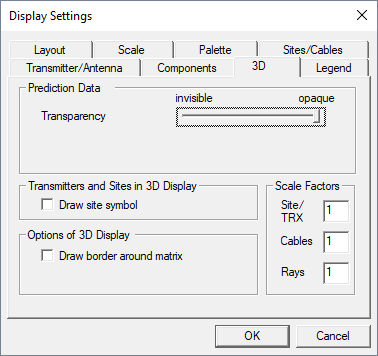
Figure 1. The Display Settings dialog, 3D tab.
- Prediction Data
-
You can choose an arbitrary transparency level for the prediction data.
In case of multi-layer results, either all prediction layers (height levels) or only the currently active one can be selected for display.
- Transmitters and Sites in 3D Display
- Site symbols can be hidden optionally in the 3D View.
- Options of 3D Display
- A border around the simulation environment can be shown additionally.
- Scale Factors
- The size of the site/antenna symbols in the 3D View can be changed with a scaling
factor. Scaling factors for the size (diameter) of feeder cables and ray paths can
be specified here as well. Result data in 3D View can be rotated and zoomed with
the mouse.Note: Click and click the Layout tab to specify which data of the current layout is to be shown.
Examples
The following examples show prediction results in an urban environment and inside a subway tunnel, respectively.
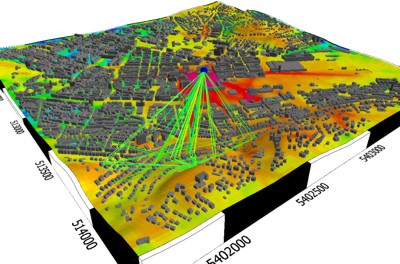
Figure 2. Example of prediction results in an urban environment.
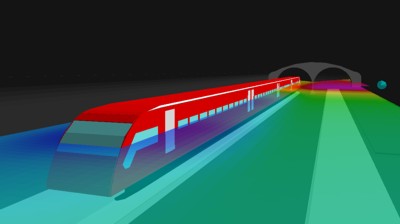
Figure 3. Example of prediction results in a subway tunnel.