View Print3D Results
View, animate, and plot the results of a 3D printing analysis.
-
Click Show Analysis Results
 on the Analyze icon to open the Analysis
Explorer.
on the Analyze icon to open the Analysis
Explorer.
-
Select a run and result type. The result is displayed in the modeling
window.
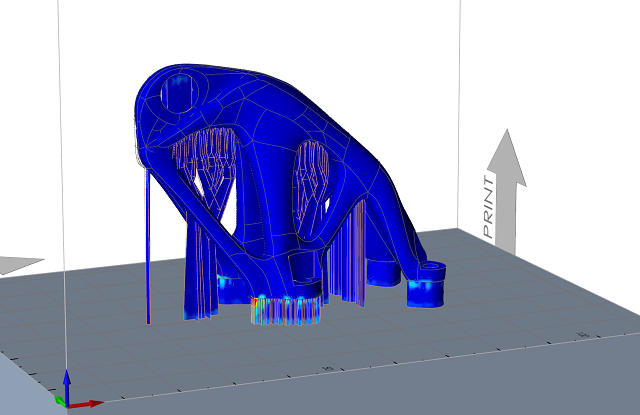
The results slider is scalable and provides a color gradient for the selected result type.
- To change the upper or lower bound for the results slider, click on the bound and enter a new value. Click the reset button to restore the default values.
- To filter the results so that areas on the model with results greater than a specified value are masked, click-and-drag the arrow on the results slider.
- To change the legend color for the result type, click the icon next to the results slider and select Legend Colors.
- To delete a run from the Analysis Explorer, right-click the run name to select Delete Run from the context menu.
Result Types for Print3D
3D printing analysis produces results for displacement, plastic strain, von Mises stress, nodal temperature, and temperature.
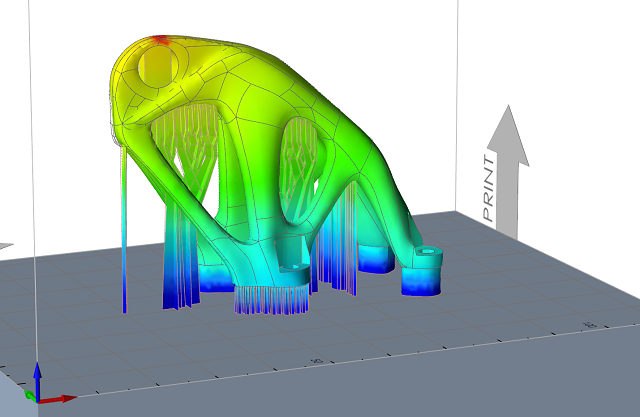
Displacement
The displacement result type shows how much your model will displace or deflect during the 3D printing process. The areas of the model that are the darkest orange will have the most displacement.
When reviewing displacement results, you should check that the order of magnitude of the displacement and the shape of the deformation make sense. Use the Animation tools on the Analysis Explorer to view the shape of the deformation.
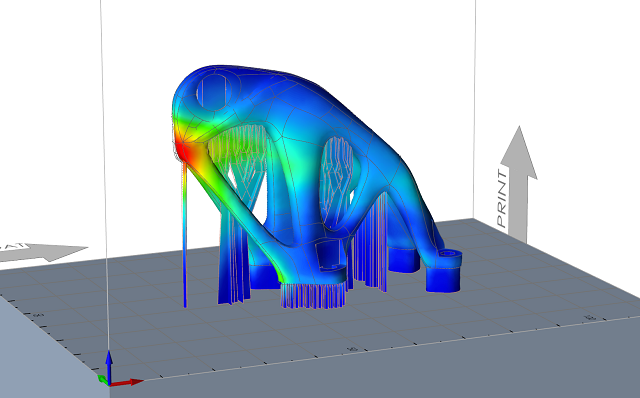
Plastic Strain
Plastic strain result type shows which parts have exceed their yield limit and begun to deform. The dark orange areas show the areas under the greatest strain.
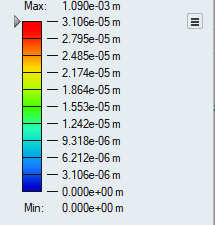
von Mises Stress
The von Mises stress results can be used to predict part performance and durability. Areas shown in orange/red have exceeded the peak stress.
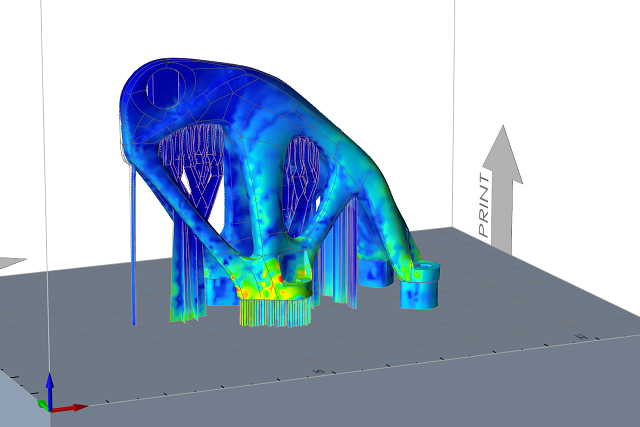
Nodal Temperature
This result type shows the actual temperature on a particular node. The highest temperatures are shown in red and the coolest temperatures in blue. Nodal temperatures may be more extreme than the average element temperature.
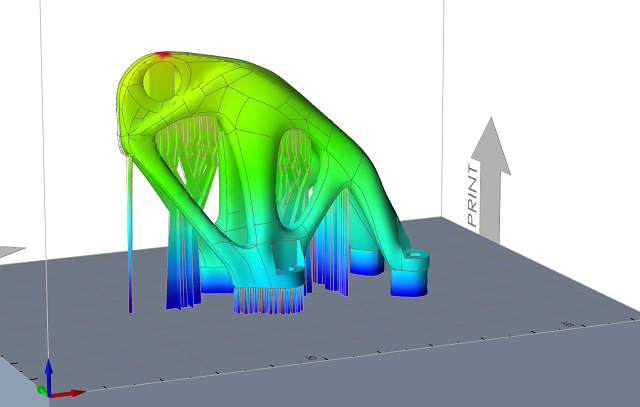
Temperature
This result type shows which areas on the part have the highest temperature (red/orange) vs. the coolest temperature (blue/green) after the printing process is completed. The temperatures are calculated as an average for each element, as opposed to the nodal temperature.