Viewing the Results
View and post-process the results in POSTFEKO.
-
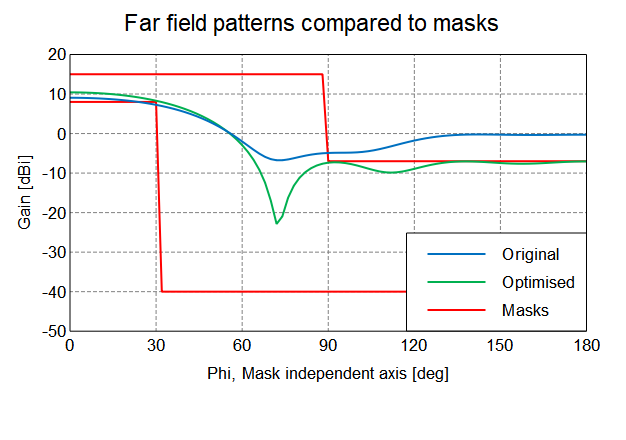
Compare the radiation pattern of the antenna for both the initial and the
optimised antenna design. The gain in the back-lobe region (between 90° and 180°) is reduced to -7 dB.
The gain in the main-lobe region (between 0° and
30°) is above 8 dB.

Figure 1. The vertically polarised gain of the Yagi-Uda antenna before and after optimisation.Tip: To view the masks on the same graph, drag each mask from the model browser onto the graph, then apply a scale of 180 (Transform axis) to each mask's trace. -
View the optimum parameter values found during the optimisation search in the
optimisation log file.
Value of the aim function (analysis no. 181) is   4.954552265e+02
Optimum found for these parameters:
l0 = 2.464426480e-01
l1 = 2.318887084e-01
l2 = 2.315246187e-01
l3 = 2.214966779e-01
s0 = 2.280809962e-01
s1 = 2.488307711e-01
s2 = 2.975472065e-01
No. of the last analysis: 212