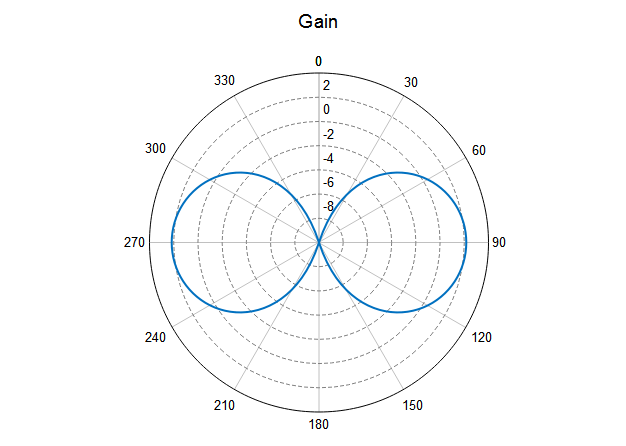
View the gain (in dB) of the requested far field pattern using a polar
plot.
On the Display tab, in the Axis
settings group, click Axis
settings, and then click the
Radial tab. Set Maximum dynamic
range in dB to 10 dB.
Figure 1. A polar plot of the requested far field gain (dB) viewed in POSTFEKO.
Review the impedance at a single frequency using one of the following
methods:
Plot the impedance as a function of frequency on a Cartesian graph or
Smith chart.
View the impedance value in the *.out file. Open the .out file in the output
file viewer (in POSTFEKO), or in any other
text file viewer.
                         DATA OF THE VOLTAGE SOURCE NO. 1

                    real part  imag. part   magnitude       phase
 Current   in A    1.0892E-02 -4.8046E-03  1.1905E-02      -23.80
 Admitt.   in A/V  1.0892E-02 -4.8046E-03  1.1905E-02      -23.80
 Impedance in Ohm  7.6854E+01  3.3900E+01  8.3998E+01       23.80
 Inductance  in H  7.1988E-08