Filters help in narrowing the data that is displayed and are defined by selecting a set of specific dimensional elements or a range of measure values based on the data type of the dimension. You can select a set of dimensional elements and define these filters either in the Dimensions pane or in the Filters tabbed page of the Filters and Settings pane. Envision also allows you to create bookmarks that allow you to view a chart or report with pre-defined filters called bookmarks. For more information on how to create bookmarks, see Creating Bookmarks.
Essentially, Envision has two types of selectors for value or range selection of metric values - Histogram and Linear. The Histogram selector is displayed with a tool tip and allows you to select a range of values by dragging within the range, whereas, the Linear selector allows you to specify the exact range on the line by using the range selector. For dimensions of type 'date', Envision offers two types of filters - Enumeration Filter and Quick Filter.
Example 1
Consider a report that displays the Sales Cost for all channels. By default, a histogram displays the entire range. However, you can specify a range of values for the filter to only display the Quantity Ordered in a particular range - $0 billion to $121 billion.
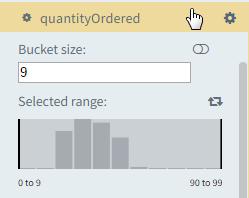
Specifying the filter settings for a numeric data type using the histogram filter
1. In the Dimensions pane or on the Filters tabbed page of the Filters and Settings pane, select the dimension for which you want to define the filter range.
2. Drag the range indicator to display the range of data on the histogram bars.
3. Specify
the bucket size for displaying the bars (range for the x-axis values of
the histogram bars), and then click the  icon to
display the range that you have specified.
icon to
display the range that you have specified.
Specifying the filter settings for a numeric data type using the linear filter
1. In the Dimensions pane or on the Filters tabbed page of the Filters and Settings pane, select the dimension for which you want to define the filter range.
2. Click
the  icon to select the Linear
filter.
icon to select the Linear
filter.
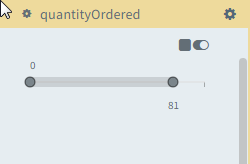
3. Drag the range indicator to define the range of data to be displayed (Between [0y, 69.5] and [121, 121] billion).
4. Optionally,
click the  icon to use the Histogram
indicator.
icon to use the Histogram
indicator.
icon is used to switch from the Histogram filter to
the Linear filter and vice versa. For example, If you there exists
a range from 0-100, and you have selected the range [20-40] in the
range selector, clicking the icon changes the
selection between the ranges [0-20] and [40 -100]. Also, Envision
displays the  icon next
to a dimension to indicate that a filter has been applied previously
to the dimension.
icon next
to a dimension to indicate that a filter has been applied previously
to the dimension.Example 2
Consider a report displaying Sales cost for all Channels which can be filtered to display only a few channels. In this case, the filter is created by selecting the specific channels to display.
Specifying the filter settings for a string data type
1. In
the Dimensions pane
or on the Filters tabbed page of the Filters and
Settings pane, click the  icon to display
the dimensional elements and then select the check box next to the dimensional
element that you want to display.
icon to display
the dimensional elements and then select the check box next to the dimensional
element that you want to display.
Or
2. Click
the  icon next to the dimension
name, and then select Filter.
icon next to the dimension
name, and then select Filter.
i. Select Clear all to clear the current filter selection.
ii. Select Invert selection to change the current selection; so that the previously unselected elements will now be selected and vice versa.
iii. Select Multi Select to switch between selecting multiple dimensional elements or a single dimensional element.
Specifying quick filter settings for date data type
1. In the Dimensions pane or on the Filters tabbed page of the Filters and Settings pane, select a dimension of date data type.
2. Click
the icon next to the dimension
name and then select Filter > Range Selector to display pre-defined filters.
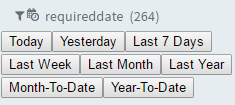
3. Select any of the filters to filter the dimension relative to the current date.
Specifying enumeration filter settings for date data type
1. In the Dimensions pane or on the Filters tabbed page of the Filters and Settings pane, select a dimension of date data type.
2. Click
the icon next to the dimension
name and then select Filter > Enumeration to view the dimensional elements
as a list.
3. Select any of the dimensional elements by clicking the check box next to the dimensional element.
A data set with a large amount of zero or NULL entries (more than 90-95%) is sparse. Sparsity occurs naturally in data models, and Envision handles these sparse dimensions effectively, as browsing those dimensions that do not contain any data is useless. While browsing sparse data, only those dimensions which contain data are traversed.
Sparse browsing in Envision is particularly useful during filtering when the dimension rows that contain sparse data are not displayed, and you are always in the space containing data.
Enabling or disabling sparse browsing
1. On the Filters and Settings pane, select the Filters tabbed page.
2. Select the Sparse Filter check box to enable or disable sparse browsing.
These values are now hidden or displayed in the chart or visualization.