A Map chart is used for a wide variety of purposes, for example, to plot sales data per region or per store. You can also create a Map or Geographic Information System (GIS) chart if the data set includes unique latitude or longitude information for the selected geo-spatial dimension.
You create a map by adding a measure value or an expression to the dimension, and use the size or color of the points to reflect the size of the measure. The marker style renders circles at specified locations on the Map chart with the color and size that you specify in the color dimension and measure respectively.
Map chart variants
|
|
|
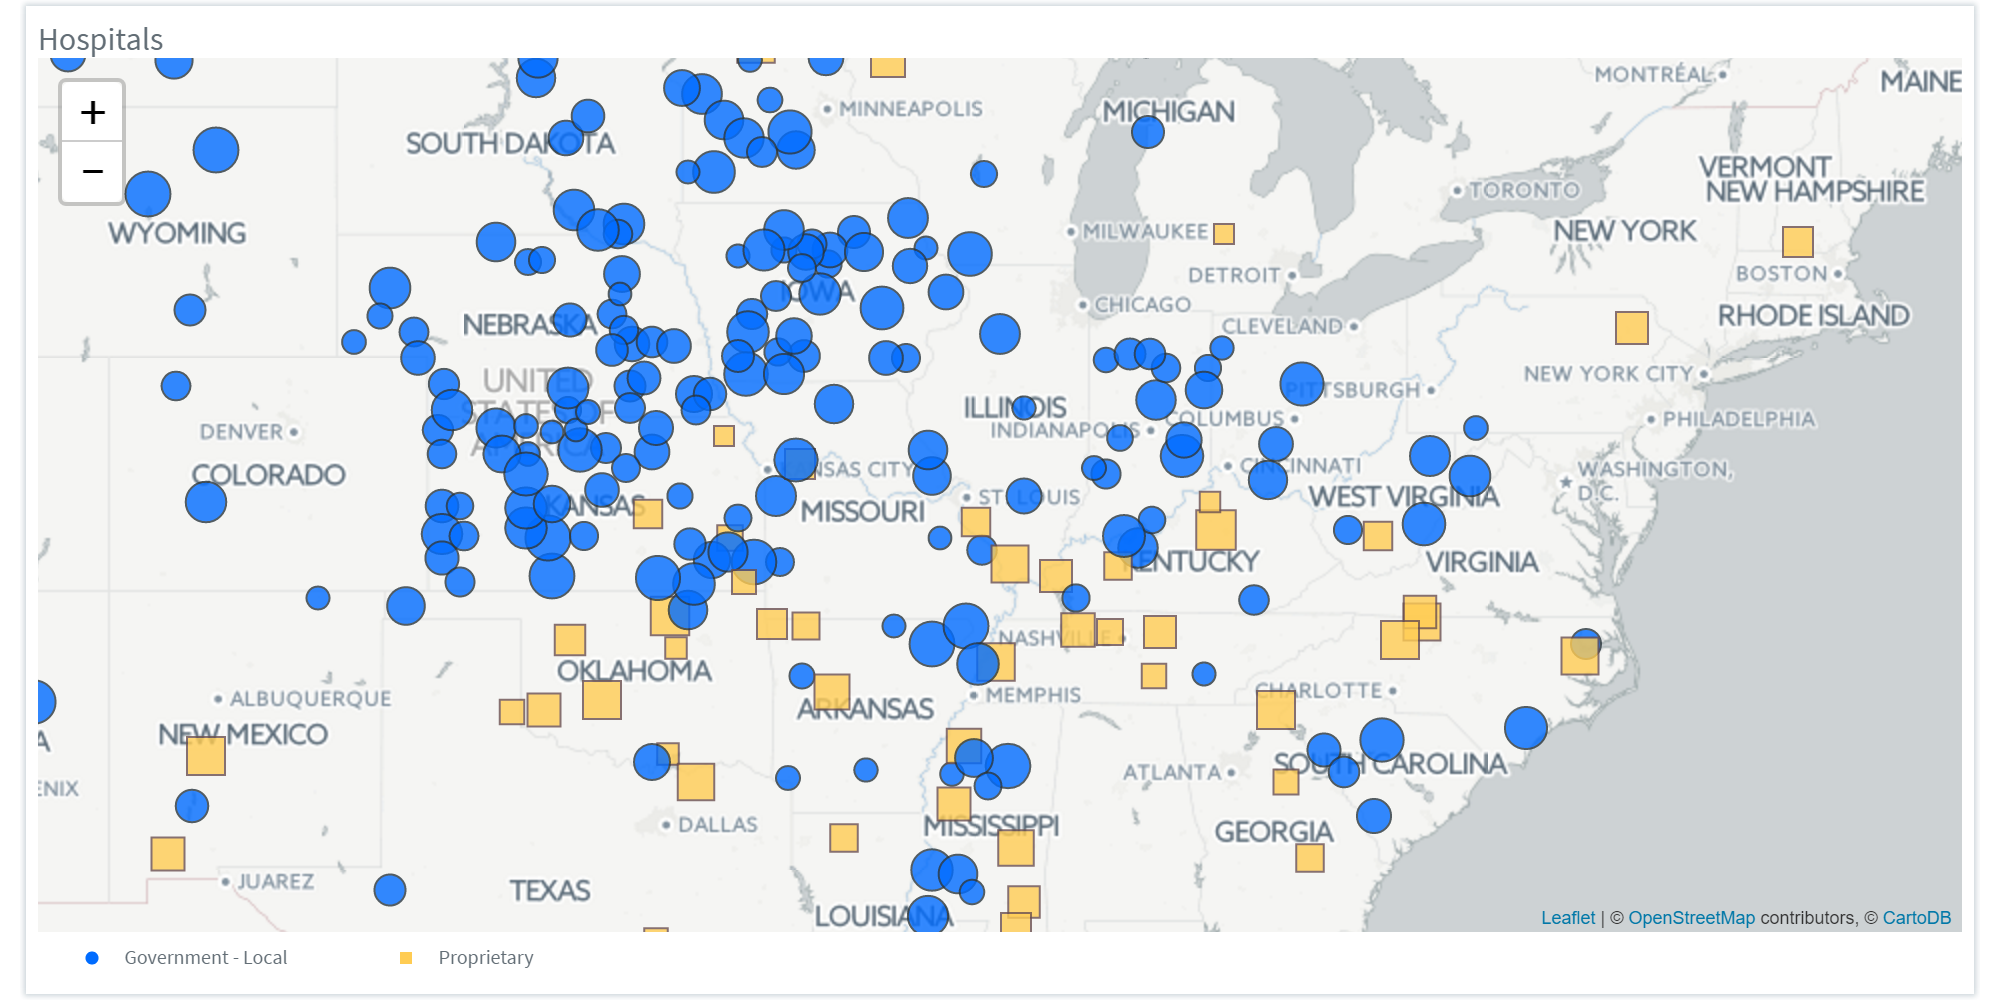
Map-Markers |
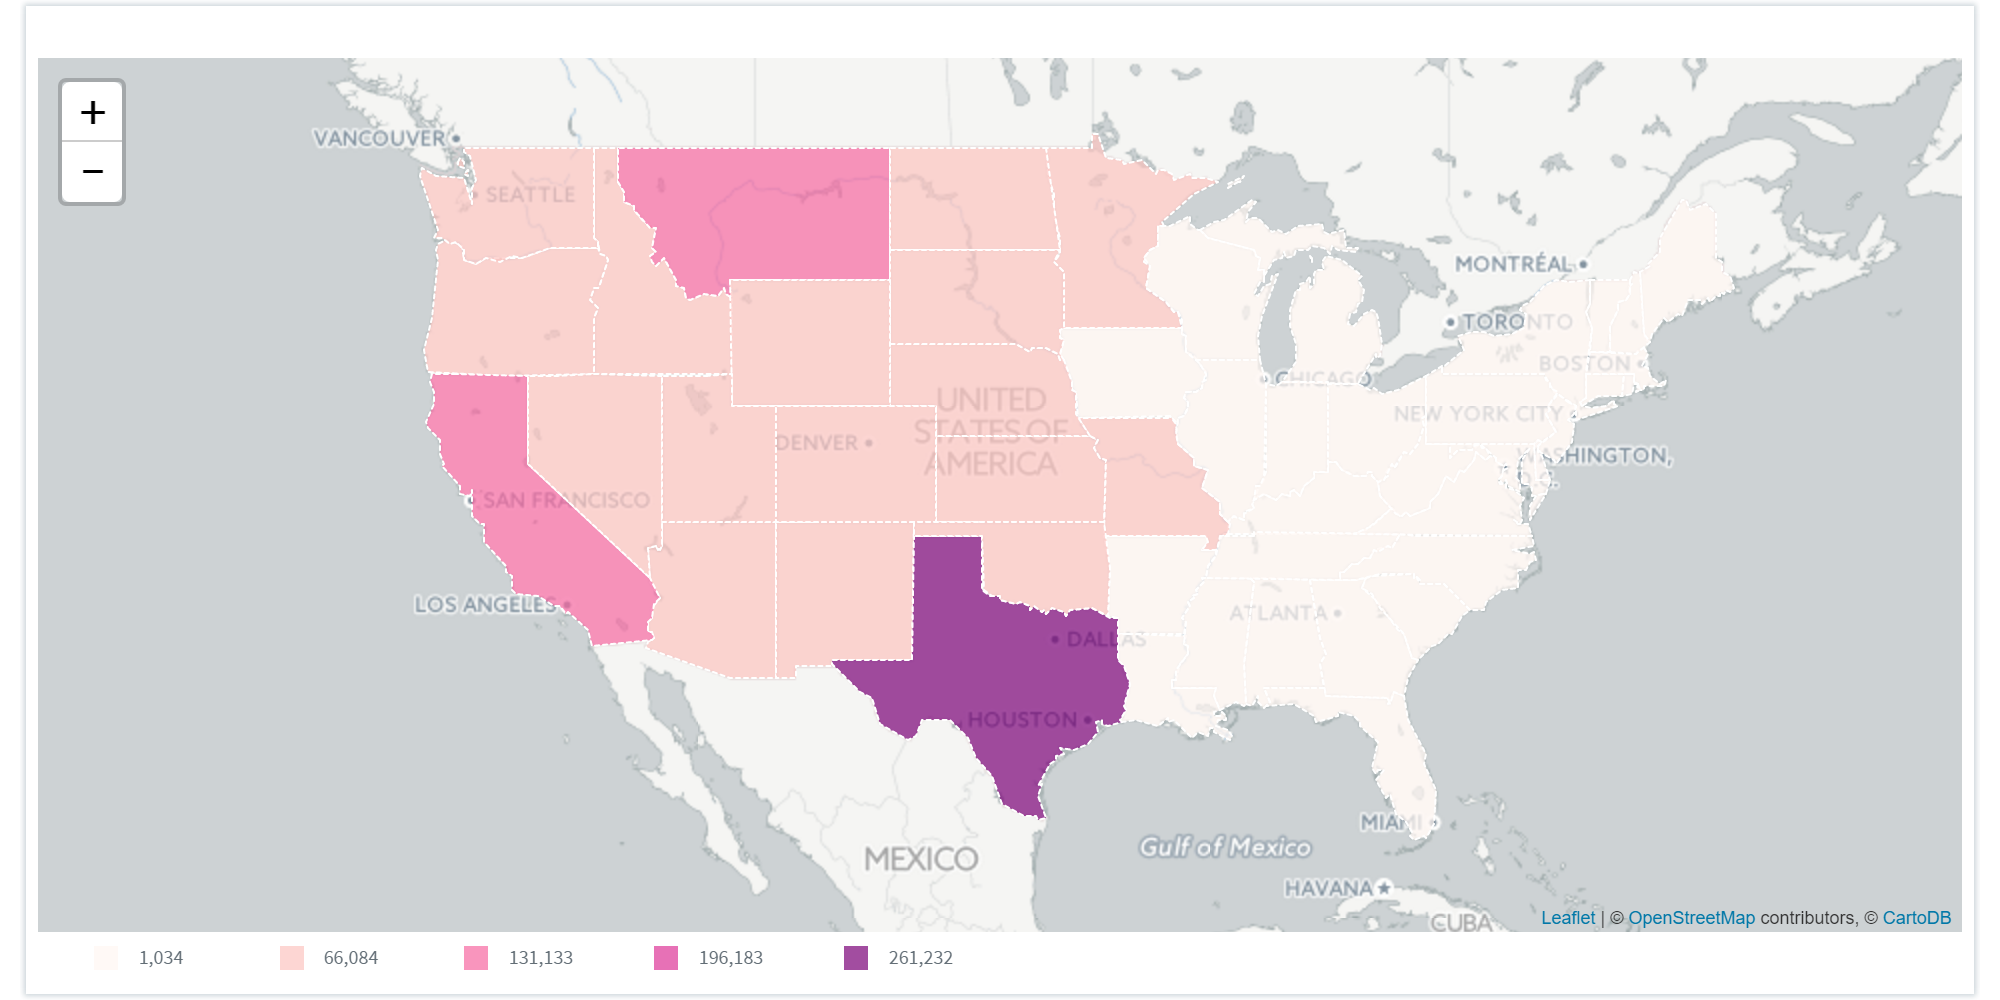
Map-Area |
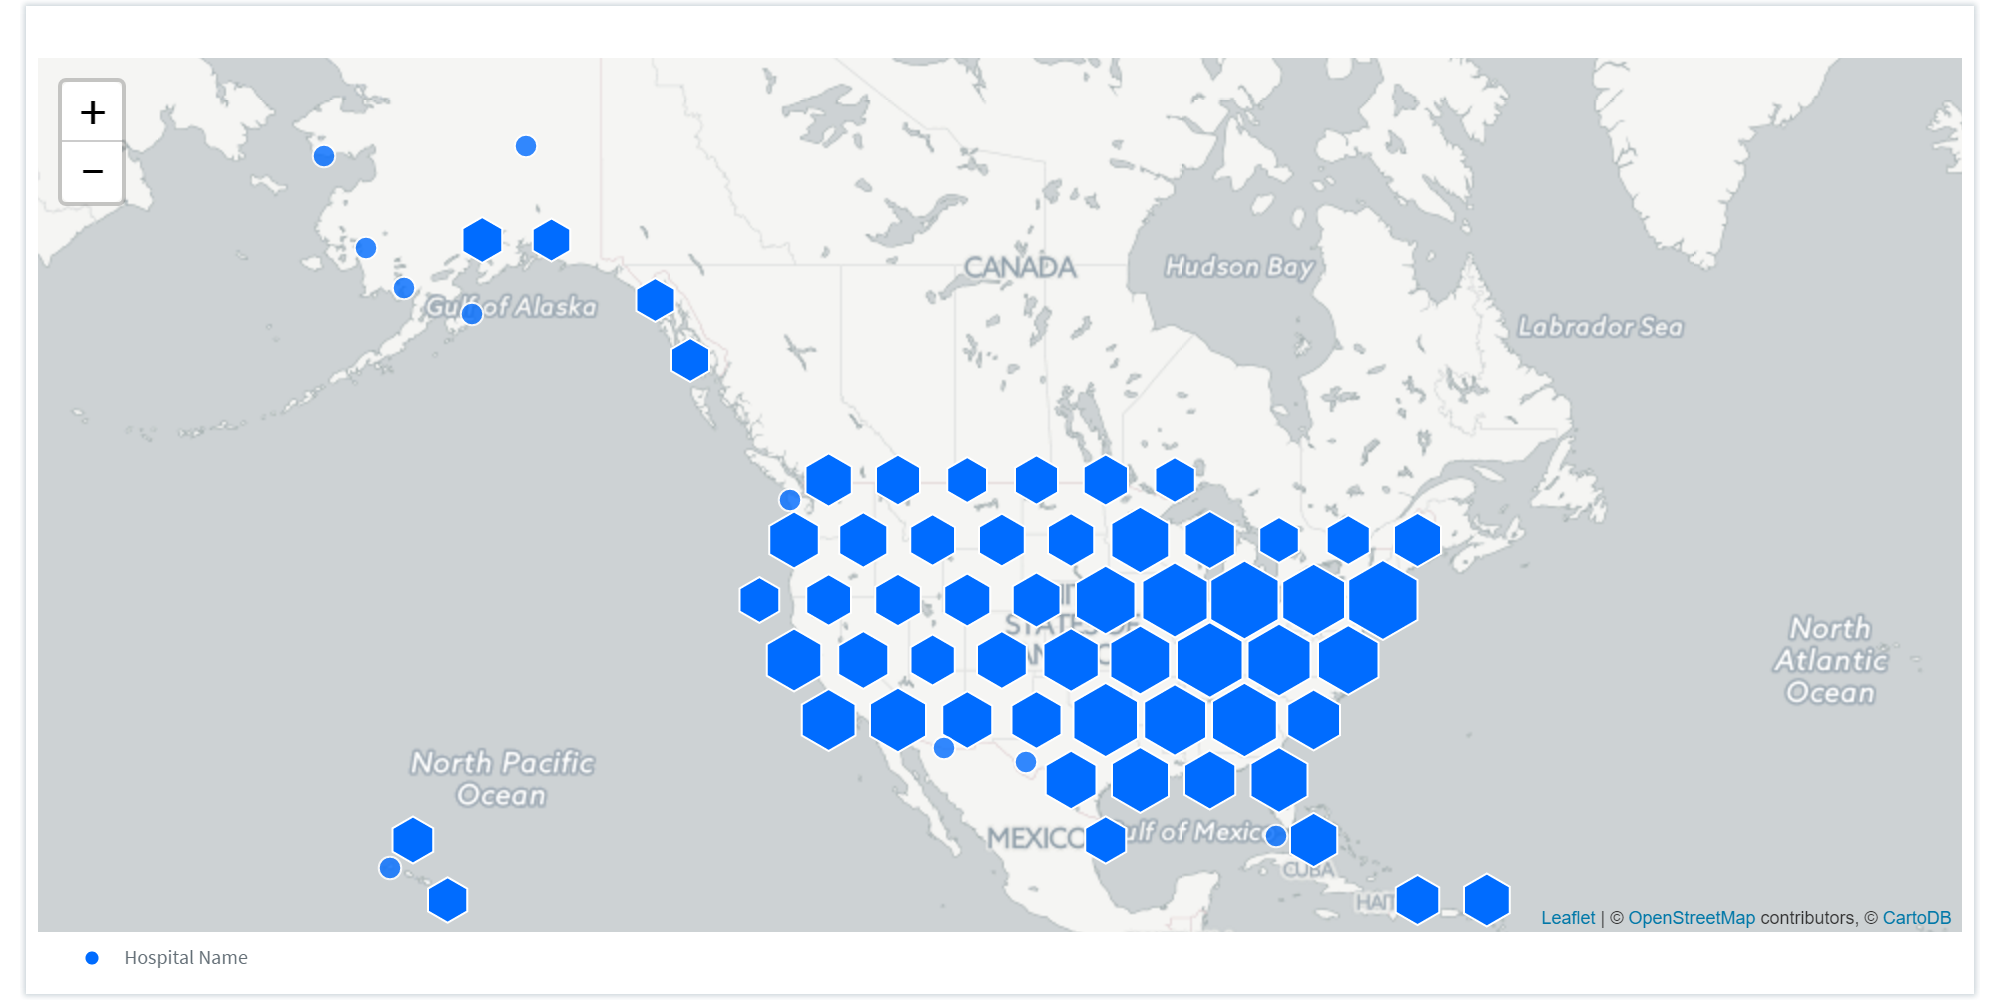
Map-Cluster |
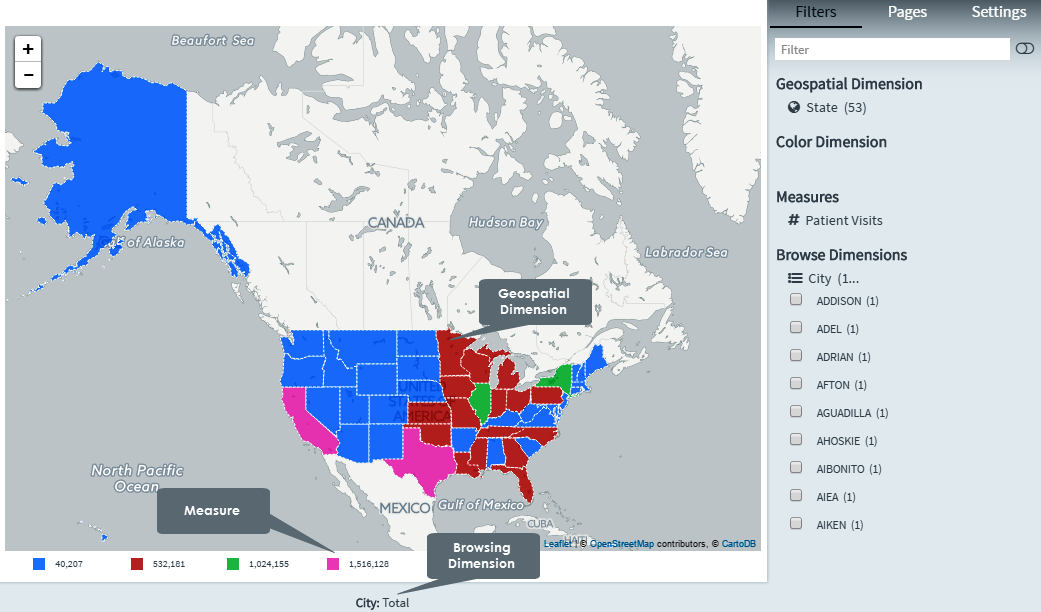
Map charts are particularly useful for displaying the geographical distribution of offices, hospitals, stores, and other sites of business interest. You can visualize not only the locations but also sales values and other measures, and display the value differences by bubble size or color.
The map is a versatile visualization that efficiently presents the geographical distribution of key values related to location or area. However, with a large number of values, it may be hard to get a good overview. Values may appear cluttered and are not clearly visible until you zoom in.
Creating map charts
1. On the toolbar, select + New Page from the Pages drop down, or on the Filters and Settings pane, select the Pages tabbed page and then click the + icon to create a new page.
2. Click
the ![]() icon in the chart area
and then select the Advanced tabbed page.
icon in the chart area
and then select the Advanced tabbed page.
3. Select
the Map chart type or click the icon at the top right corner of the chart area and then
select Map to create a Map chart.
icon at the top right corner of the chart area and then
select Map to create a Map chart.
4. From the Dimensions pane, specify a Geo Spatial Dimension for the Map chart. Before you define a geo spatial dimension, you must associate the dimension with a CSV or a JSON file containing geo spatial data. For more information on how to convert a dimension with a geo spatial dimension containing geo spatial data, see Associating geo spatial data with a dimension.
5. Specify a Color Dimension for your chart.
6. Specify a Measure for your chart.
7. In the Filters and Settings pane, select any of the following:
▪ Filters tabbed page to browse the chart dimensions using the Dimensions Browser.
▪ Pages to view all pages in the current report as thumbnails.
▪ Settings to define drill through, page, or report properties for the chart.
Defining map chart properties
Envision allows you to define chart properties such as title, marker, display, legend, and drill through.
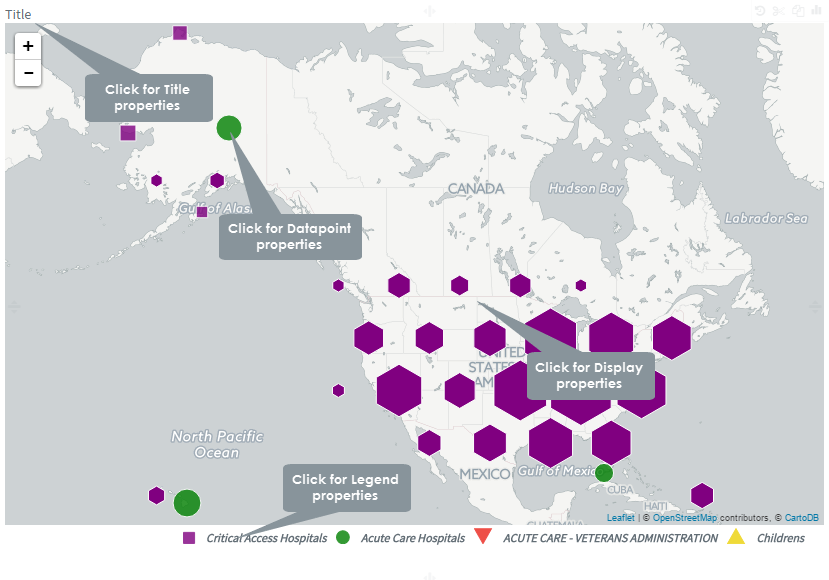
The following table explains how to define these properties.
| Title properties | ||
| Property | For | Specify |
|
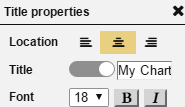
Location | Select a location (left, center, right) for the title. |
| Title | Click the indicator to display or hide the chart title. Specify a new title for your chart. |
|
| Font | Select a font size and style (bold, italic) for the title. | |
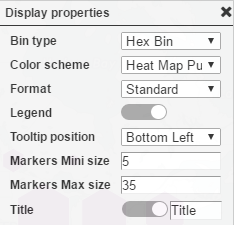
Display properties |
||
|
Bin Type | Select the bin type (hex bin, none) from the list. |
Color Scheme |
Select a color scheme from the list of available color schemes. | |
| Format | Select a format from the list of available data formats. | |
| Legend | Click the indicator to display or hide the legend. | |
| Tooltip position | Select the position for the tooltip (bottom left, bottom right, top left, on pointer) from the list. | |
| Markers Mini size | Specify the minimum size for the marker/color dimension. | |
| Markers Max size | Specify the maximum size for the marker/color dimension. | |
| Title | Click the indicator to display or hide the chart title. Specify a new title for your chart. |
|
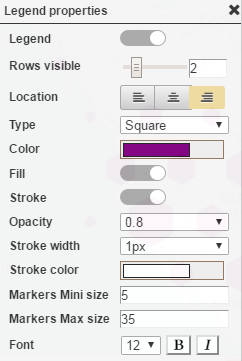
Legend properties |
||
|
Legend | Click the indicator to display or hide the legend. |
| Rows visible | Drag the indicator in the range 1-10 to display the number of visible legend rows. | |
| Location | Specify a location for the legend display (left, center, right). | |
| Type | Select a marker type for representing the legend. | |
| Color | ||
| Fill | ||
| Stroke | ||
| Opacity | ||
| Stroke width | ||
| Stroke color | ||
| Markers Mini size | Specify the minimum size for the marker/color dimension. | |
| Markers Max size | Specify the maximum size for the marker/color dimension. | |
| Font | Select a font size and style (bold, italic) for the legend. | |
A geo spatial dimension is one which is generally associated with geo spatial data constituting latitude and longitude information such as City, State, and so on. Before you create a Map chart, you must first associate a dimension with geo spatial data to obtain latitude and longitude coordinates. Envision allows you to import and then associate two types of file formats containing geo spatial data - CSV and JSON.
Uploading Geo json files
1. From
the Dimensions pane, select a dimension that you want to define as geo
spatial, and then click the  icon.
icon.
2. Select Format and then select Geo-Spatial.
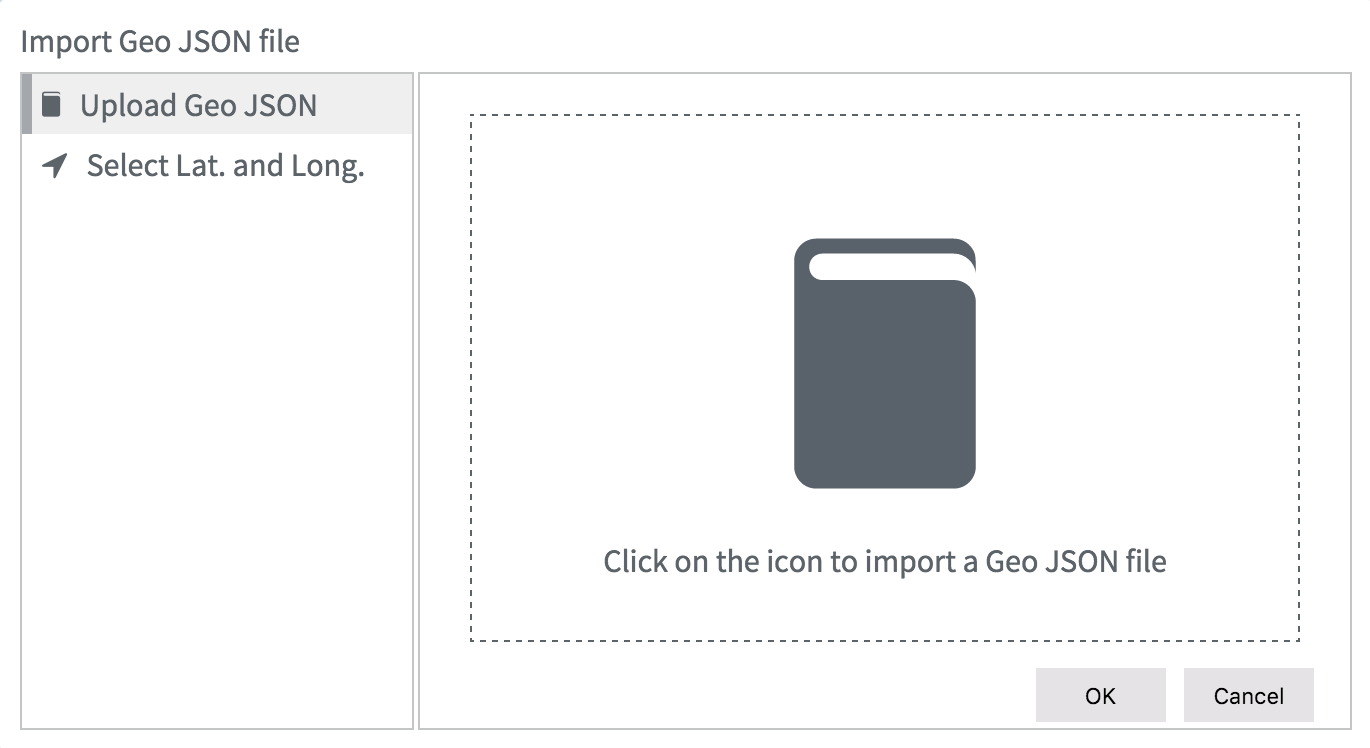
3. In the Import Geo JSON file dialog box, select the Upload Geo JSON tabbed page, and then drag and drop to import the Geo JSON file or, click the icon to browse to the folder containing the Geo JSON file and then click Open.
4. Select the property to be mapped from the drop down, and then click OK to save the changes.
Optionally, click Cancel to discard the changes that you have made.
Associating Latitude and Longitude with existing dimensions
1. From
the Dimensions pane, select a dimension that you want to define as geo
spatial, and then click the icon.
2. Select Format and then select Geo-Spatial.
3. In the Import Geo JSON file dialog box, select the Select Lat and Long tabbed page, and then specify the following details:
| For | Specify |
| Select a Data Source | Select a data source from the drop down. |
| Latitude | Select latitude from the drop down. |
| Longitude | Select longitude from the drop down. |
4. Click OK to save the changes.
Optionally, click Cancel to discard the changes that you have made.
|
|
Page Properties |
Report Properties |