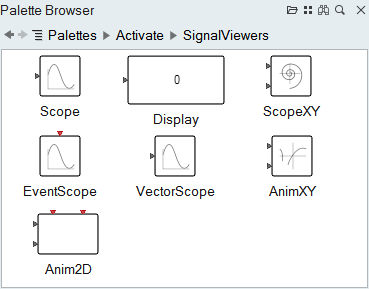
Viewers

Viewers are types of blocks for displaying particular results during the simulation of a model. Viewers include scope blocks and the Display block.

Scopes

Scopes are blocks that you can include in a model for plotting and monitoring simulation results.

A variety of predefined scope blocks are available in the Palette Browser from Palettes > Activate > Signal Viewers:
With scope blocks you can plot signals versus simulation time or other signals. You can also plot activation events. For more information about specific scope blocks, select a block, and then press F1 to view the block's help page.

When to Use Scope Blocks

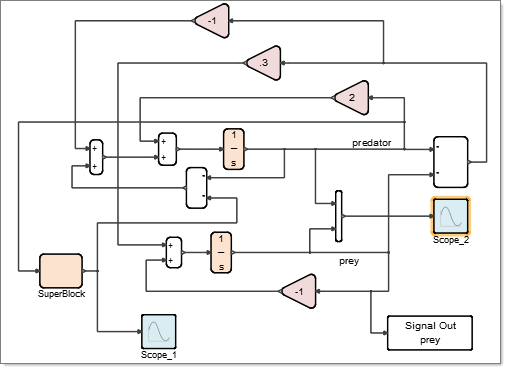
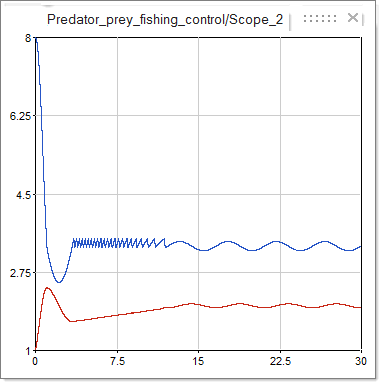
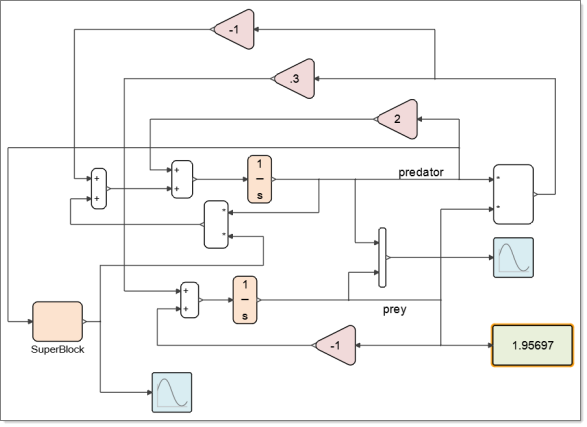
You connect a scope block to each signal in a model that you want to review. In the following example of a classic predator-prey model, Scope_2 on the right of the diagram is defined to plot the evolution of population over time:

The plot generated from the Scope_2 block provides the following results:

Scope Plots

Running a simulation creates a plot for each scope block in the model. The name of each scope plot appears in the Project Browser in the Scopes & Plots branch near the top of the tree. Scope plot names are automatically generated from the model name combined with the scope block name as you see in the following figure:
Note: Scope plots refresh after every simulation. Closing a model clears the plots from the session.

Display Scope Plots

After running a simulation, a plot appears in a floating window for each scope block in the model. You can close the plots, make modifications to the scope blocks, and reopen the plots from the Project Browser or directly from the scope block.

To display the plot of a scope block, double-click the scope block from its diagram, or from the Project Browser, under Scopes & Plots, double-click the name of the plot from the tree.
The software generates a plot according to the parameters defined in the scope block.

Add Titles and Legends to Scope Plots

Add a header, footer or legend on a plot generated from a scope block.

  1. To add or display a header or footer for an axis on a scope plot, select View > Property Editor.
    The Property Editor appears.
  2. After running a simulation, on a scope block, double-click. On the tree of the Property Editor, define a Header, Footer, Legend, and a number of visual properties.
    To Do this
    Display a Header, Footer or Legend Select the Visibility check box.
    Add or modify a Header or Footer In the Title field, click and enter a title.
    Modify colors, fonts, and borders Select from the options to specify color, fonts, background and line color as required.

Display Block

The Display block exposes a specified value during a simulation. Just like a scope block, you can connect the Display block to any signal.

The following example shows a diagram of a predator-prey model. A Display block is connected to the right of the diagram and is defined to display a population value. The Display block updates as the population evolves during the course of a simulation. The value highlighted in the figure is the last value at the final time of a simulation run.

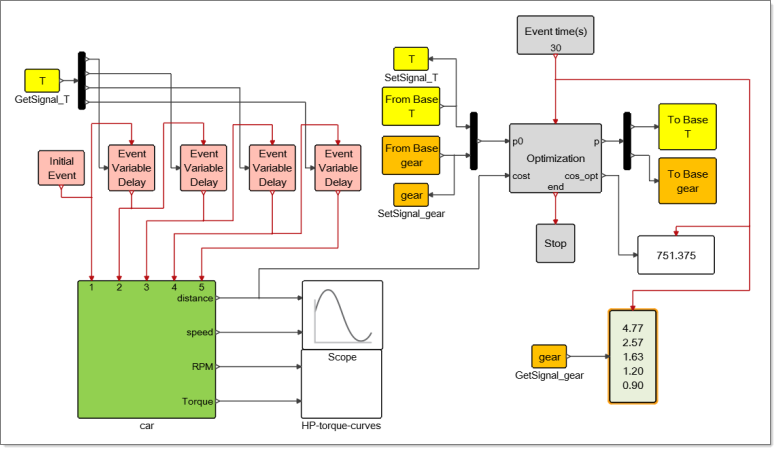
The Display block can also display vectors and matrices. The example below is from the Extended Definitions and shows in the green block the optimal gear box ratios obtained after optimization: