Create a Dashboard Using the SmartWorks Iot Connector
This connector enables you to retrieve the data stored in AnythingDB.
Important: To visualize data stored at the Raw History section in
AnythingDB, or the data stored in a collection, you will first need to create an
app. If not, skip Step 1 and begin at Step 2.
Click Access Control > Apps and create a new App by following these steps.
Note: The Application Client ID and Secret ID is required in configuring the New
Workbook in Real time Vizualization module. Be sure to capture and save this
information.
Click Real Time Visualization > Workbooks.
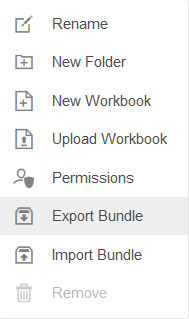
Select a folder to work in. By default a root folder with your username has
been created. Right click to see the different operations you can perform.
Figure 1.
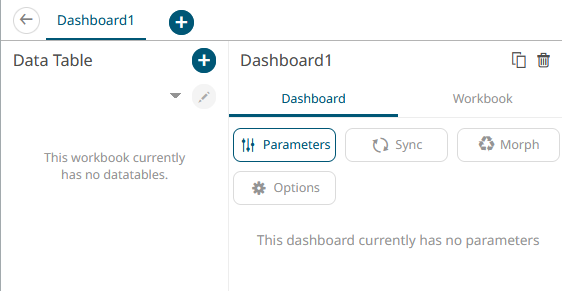
Click New Workbook.
Enter a name for the Workbook and click Create.
Figure 2.
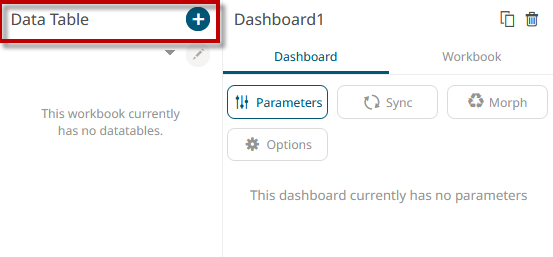
Create a Data Table by clicking the + icon.
Data tables define the queries and source data repository definitions, in
order to retrieve data. Figure 3.
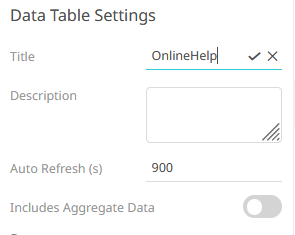
Under Data Table Settings, enter a title and click the check mark to save it.
Enter a description, if desired.
Figure 4.
With Data Sources highlighted, under File/URL, select SmartWork
IoT.
Enter the following:
Client ID: from the app created in Step 1
Client Secret: from the app created in Step 1
Grant Type: type of app created in Step 1. Here we use
client_credentials.
Scope: from the app created. Choose thing if you
want to retrieve the Thing status of a collection, and
Data if you want to retrieve the data stored
at the Raw History section.