


|
The Report Design Window
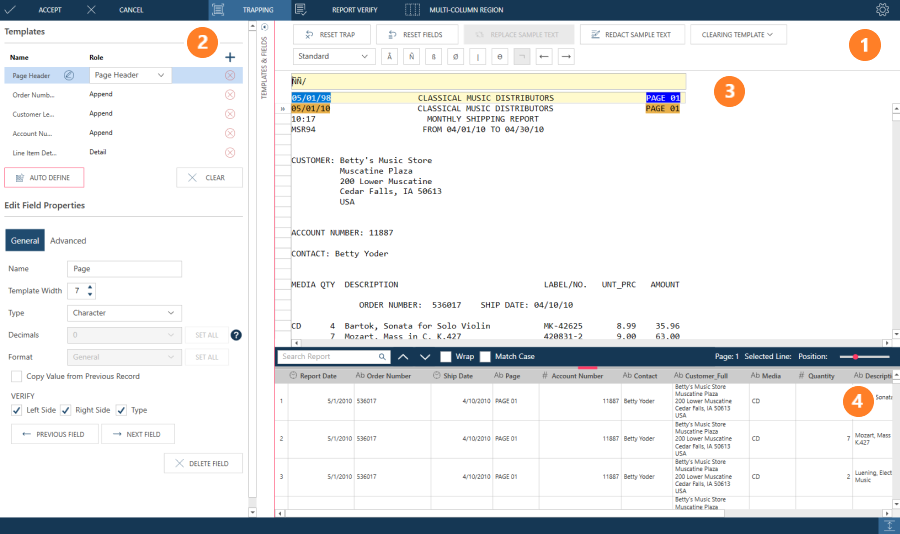
The Report Design Window is launched when you add a PDF or report document as a data source to your Data Prep Studio session. This window allows you to select specific fields on a report to include in a table via trapping. The resulting table becomes available in the Preview Window.
Report Design Window Panels
|
Panel |
Description |
|
1 |
Report Design Toolbar See below for a full description of each tool. |
|
2 |
Displays the currently active document as well as the effects of your trapping operations. |
|
3 |
Template and Field Properties Panel Displays the properties of all defined templates and fields. |
|
4 |
Zoom Slider Slide to the left or right to zoom in or zoom out of a document. By zooming out, you can see more of the document area. |
The Report Design Toolbar
|
Toolbar |
Description |
|
Accept |
Accepts the document preparation. The Report Design window is closed and the table you have just defined becomes available in the Preview Window. |
|
Cancel |
Cancels all trapping operations and closes the Report Design window. |
|
Trapping |
Initiates trapping operations for your PDF or report document. |
|
Report Verify |
Checks that all defined fields are properly bounded. |
|
Multi-column Region |
Initiates trapping operations for documents containing data in multiple columns with the same structure. |
|
Document Options |
Provides settings that will help you control how text is displayed in your document. Note that this tool only displays when a PDF report is opened. |
|
Document Selector |
When a Monarch node contains several reports, this selector will allow you to choose one of those reports to displays in the Report panel. |
|
Report Discovery Settings |
Displays general settings, such as auto-define sample size and display options, for the Report Discovery window. In detail:
|
Related Links