During a HyperView session, you can access the HyperForm Utilities menu which includes all of the relevant tools for post-processing stamping results.
Copying Required Files
| 1. | Create a working directory. |
| 2. | Copy the results file, Thinning.h3d, into your working directory. |
Note: The model files for this tutorial are located in the file mfs-1.zip in the subdirectory \hf\Incremental\. See Accessing Model Files.
Loading the HyperForm Utilities Menu
| 2. | Select File > Load > Preference File. |
| 3. | From the Preferences dialog that appears, select HypeForm Utilities, and then click Load. |
The HyperForm Utilities menu loads into HyperView and appears on the toolbar between Preferences and Applications.
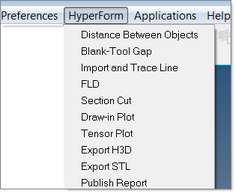
The following exercises show you how to use the HyperForm post-processing tools:
Calculate the distance between any two objects.
| 1. | Select File > Open > Model. |
| 2. | Below the graphics area, for the Load model field, navigate to the results file: Thinning.h3d. |
The file loads in both the Load model and Load results fields.
| 4. | To move to the last step of the simulation, on the animation toolbar, click the last option: |

| 5. | In the tree of the Model browser, under Components, click  next to Punch and Blank Holder. next to Punch and Blank Holder. |
The display of the Punch and Binder is cleared from the model graphics.
| 6. | From the toolbar, select HyperForm > Distance Between Objects. The Distance Between Objects dialog appears with the Component button for Part activated with a cyan border. If the button is not activated, click it. |
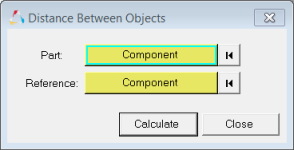
| 7. | In the graphics area, select the Blank component in the model. |
| 8. | In the Distance Between Objects dialog, for Reference, click the Component button. |
| 9. | In the model graphics area, select the Die component. |
| 10. | In the Distance Between Objects dialog, click Calculate. |
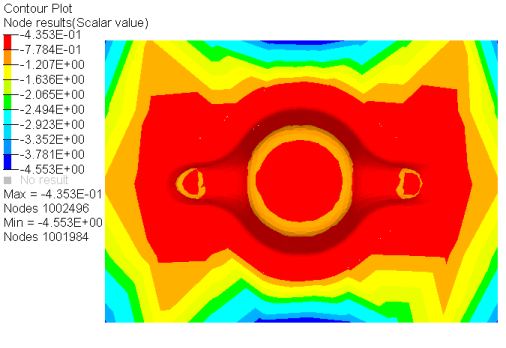
The screen splits into two halves, and a distance plot appears as you see next. The plot shows the distance of every node of the part with respect to the die. The blank thickness for this part is 1.2 mm. A gap of 0.6 mm is allowed between the part and the die.
| 11. | On the dialog, click Close. |
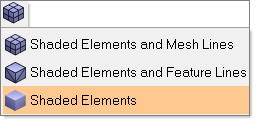
| 12. | On the toolbar, select Shaded Elements. |
| 13. | On the toolbar, select the Contour tool  . . |
| 14. | From the Contour options that appear, select the Legend tab, and then clear Max and Min. |
| 16. | On the Edit Legend dialog, in the legend, select the top value, enter 1.2, and then press Enter. |
|
Display the gap between the blank and tools at any given time step.
| 1. | In the tree of the Model browser, under Components, click next to Punch. |
The display of the Punch is cleared from the model graphics.
| 2. | To move to the last step of the simulation, on the animation toolbar, click the last option: |
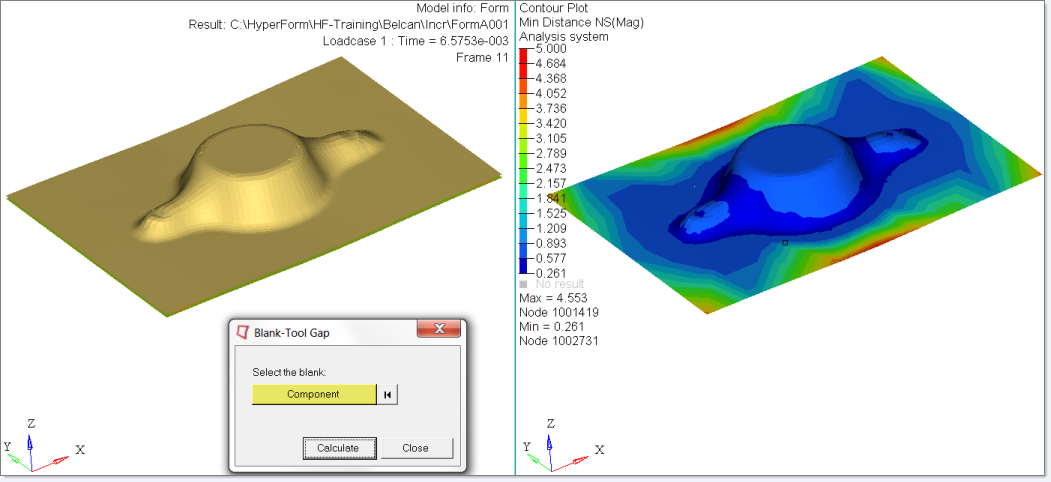
| 3. | Select HyperForm > Blank–Tool Gap, and the Blank-Tool Gap dialog appears. |
| 4. | Rotate the model to a convenient orientation and select the formed part. |
| 5. | On the Blank-Tool Gap dialog, click Calculate. |
| 6. | The HyperView window splits into two and shows a distance contour between the nodes of the blank elements and the surrounding tools. |
|
This option calculates the Forming Limit Diagram. The FLD is a measure to predict the formability of a stamped part. The FLD is represented on graph with Minor strain on the x-axis and Major strain on the y-axis.
The FLD calculation can be based on the following input:
| • | The hardening coefficient (n) from the material inputs and the blank thickness. |
| • | A user-defined Forming Limiting Curve, FLC. |
| • | Values defined for the major and minor strain to draw the FLC. |
The following exercise is based on the first method, the hardening coefficient (n) from the material inputs and the blank thickness.
| 1. | Select File > Open > Model. |
| 2. | Below the graphics area, for the Load model field, navigate to the results file: Thinning.h3d. |
| 4. | To move to the last step of the simulation, on the animation toolbar, click the last option: |
| 5. | In the tree of the Model browser, under Components, click next to Punch and Binder. |
The display of the Punch and Binder is cleared from the model graphics.
| 6. | From the toolbar, select HyperForm > FLD. On the FLD dialog that appears, click Add. |
A new study is added. The default FLC Math values are n: 0.20 and t: 1.0. Keep these default values which are the inputs for the results selected.
| 7. | Click Apply. The screen splits into two with the FLD in one half. |
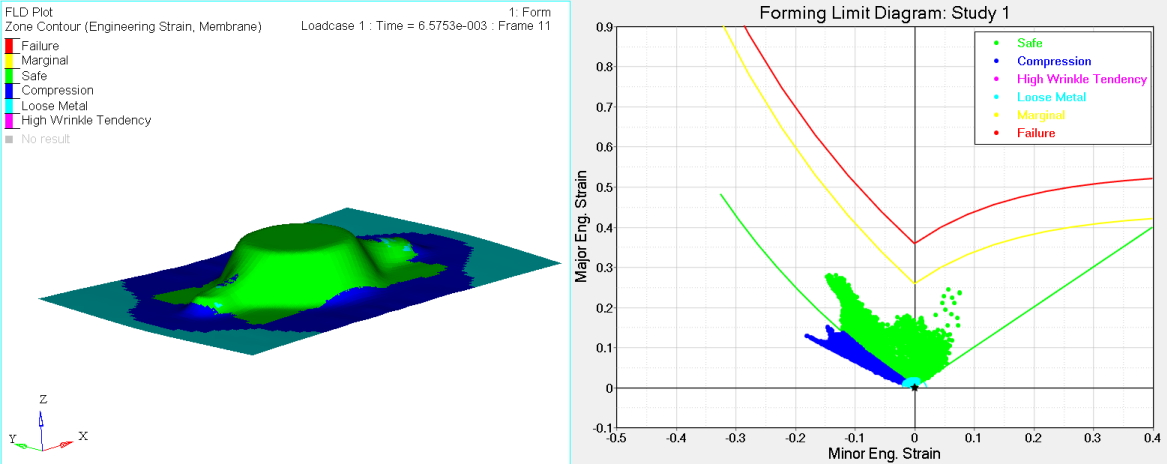
| 8. | Click the FLD tab, and then click Apply. The FLD appears as follows: |
| • | Each point on the FLD represents an element on the stamped part. |
| • | Points are plotted based on the major and minor strains that a corresponding element is subjected to during the stamping process. |
| • | The plot indicates that the part is possible to manufacture if no points appear in the red zone. Points in the blue zone indicate a tendency toward thickening. |
|
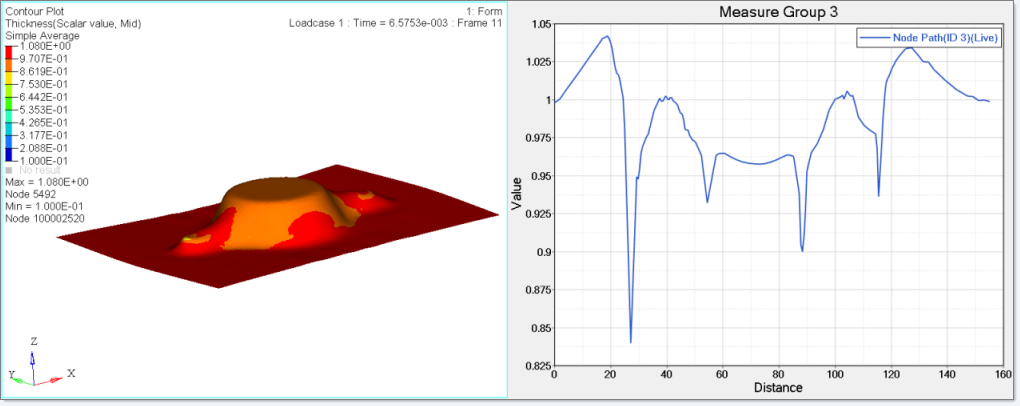
This option shows the blank thickness of a user-created section of a part at a desired time step. A contour and graph are displayed with the blank thickness on the y-axis and the draw distance on the x-axis. The animate controls let you automatically update the graph.
| 1. | From the toolbar, select File > Open > Model. |
| 2. | Below the graphics area, for the Load model field, navigate to the results file: Thinning.h3d. |
| 4. | To move to the last step of the simulation, on the animation toolbar, click the last option: |
| 5. | From the toolbar, select HyperForm > Section Cut, and the Plot Section dialog appears: |
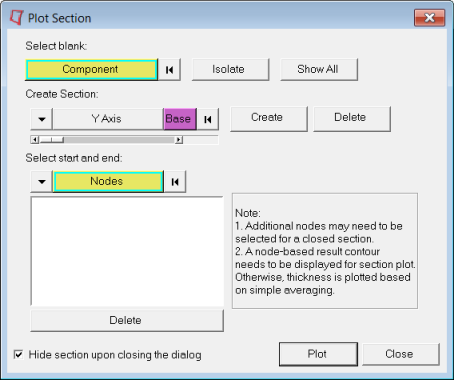
| 6. | On the model in the graphics, area, click the Blank component. |
| 7. | From the Plot Section dialog, click Isolate. The tools on the model become masked. |
| 8. | From the Plot Section dialog, under Create Section, select an axis, and then click Base. |
| 9. | Click the longer axis of the Blank as you see in the following figure: |
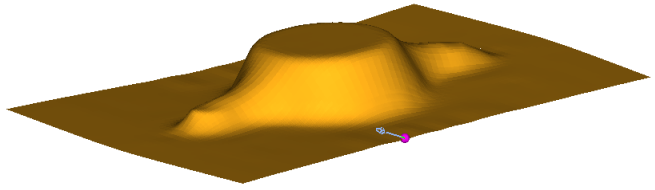
| 10. | Under Select start and end, click the Nodes button. |
| 11. | Click a node on each edge of the long surface of the blank as you see in the following figure: |
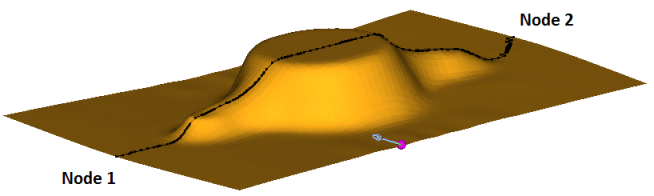
A cut appears across the blank.
| 12. | On the Plot Section dialog, click Plot. |
The screen splits into two halves with a graph in the second half as you see in the following figure:
|
This option calculates the distance between any point on a blank’s edge from a staring point to a current position. The option is one of the measures for comparing a simulated part shape to test data.
| 1. | From the toolbar, select File > Open > Model. |
| 2. | Below the graphics area, for the Load model field, navigate to the results file: Thinning.h3d. |
| 4. | To move to the last step of the simulation, on the animation toolbar, click the last option: |
| 5. | In the tree of the Model browser, under Components, click next to Punch and Blank Holder. |
The display of the Punch and Blank Holder is turned off in the model graphics.
| 6. | From the toolbar, select HyperForm > Draw-in Plot. The Draw-in Plot dialog appears. |
| 7. | For Select the blank, click the yellow Component button. Component is activated and is highlighted with a cyan border. |
| 8. | In the model graphics, click the Part component. |
| 9. | From the Draw-in Plot dialog, under Select the binder/die, click the yellow Component button. |
| 10. | In the model graphics, click the Die component. |
The plot window splits into two with the Draw-In Plot window on the right.
| 11. | In the Draw-In Plot window, click the edge of the part shape to plot the distance of that point from its initial position. The image below shows the draw-in values for Magnitude, x and y. |
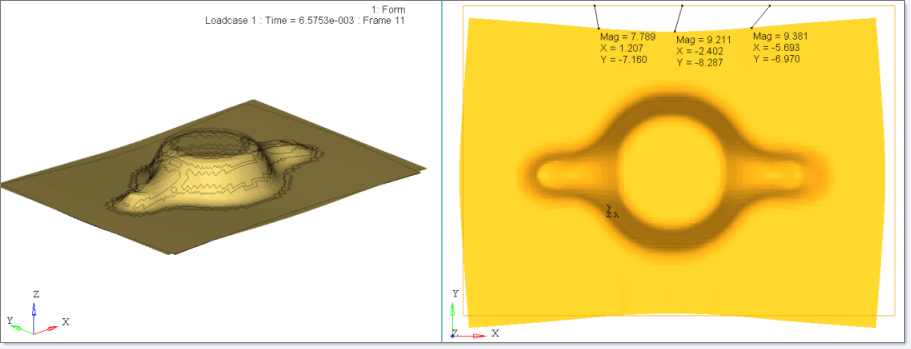
| 12. | On the Draw-in Plot dialog, click Close. |
|
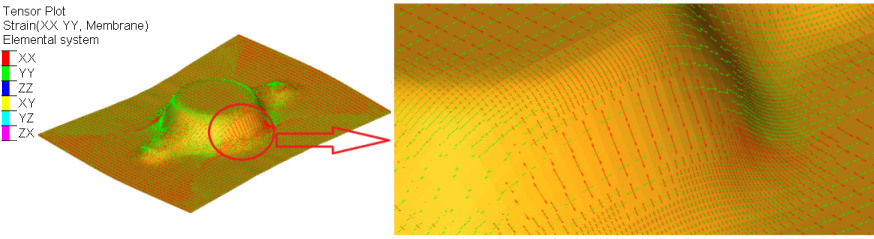
This option lets you plot the strain tensor for each element representing major and minor axes. The operation is equivalent to the deformation directions obtained for the circle grid analysis.
| 1. | From the toolbar, select File > Open > Model. |
| 2. | Below the graphics area, for the Load model field, navigate to the results file: Thinning.h3d. |
| 4. | To move to the last step of the simulation, on the animation toolbar, click the last option: |
| 5. | In the tree of the Model browser, under Components, click next to Punch, Die, and Blank Holder. |
The display of the Punch, Die and Blank Holder is cleared from the model graphics.
| 6. | From the toolbar, select HyperForm > Tensor Plot. The Tensor Plot appears: |
|
Export the shape of a part at any desired time step as an STL mesh file.
|
Publish an HTML report with Deformation, %Thinning, Plastic Strain and FLD results.
| 1. | From the toolbar, select File > Open > Model. |
| 2. | Below the graphics area, for the Load model field, navigate to the results file: Thinning.h3d. |
| 4. | To move to the last step of the simulation, on the animation toolbar, click the last option: |
| 5. | In the tree of the Model browser, under Components, click next to Punch and Blank Holder. |
The display of the Punch and Blank Holder is cleared from the model graphics.
| 6. | From the toolbar, select HyperForm > Publish Report, and the Publish Report dialog appears: |
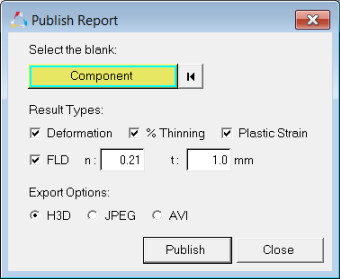
| 7. | For Select the blank, click the yellow Component button. The Component button is activated and highlighted with a cyan border. |
| 8. | In the model graphics, click the Blank component. |
| 9. | In the Publish Report dialog, for Result Types, select one or more of the given options: Deformation, % Thinning or Plastic Strain. |
| 10. | Under Export Options: select JPEG. |
| 11. | Click Publish, and an HTML file appears. |
| 12. | To close the Publish Report dialog, click g. |
|


