|
»Click here to display Table of Contents«
|

Isosurface Editor |

|

|

|

|
|
Isosurface Editor |
|
|
|

|
|
»Click here to display Table of Contents«
|
Isosurface Editor |
|
|
|
|
|
Isosurface Editor |
|
|
|
|
While slicing planes display scalar data according to geometric location, isosurfaces are defined by the data itself. The loci of points with the same data value make up an arbitrarily shaped surface in space, perhaps with disconnected regions. As with 2D contour curves, isosurfaces of different values can appear as nested shells if they are closed surfaces, so transparency is necessary to see more than one isosurface.
The options appearing on the Isosurfaces Editor panel provide customization of the isosurfaces as described below.
Isosurfaces of |
Selects which solution (or derived) component to display on the isosurfaces. To change the component displayed beside the Isosurfaces of option, click the left mouse button over the component names, and when the list of component names appears, use the mouse to select a new option. Several of the components that appear in this list may be dimmed, which indicates that they are not selected (or available) for viewing. |
Sync. Color w/Isosurfaces |
This synchronizes the slicing plane Color by option with the Isosurfaces of option on the Isosurfaces Editor panel. |
Iso range |
The Isosurfaces Editor has a slider for specifying the range of data values for contouring. Initially, the limits on the slider are the extreme minimum and maximum as found by sampling over the entire grid. You can change this interval by clicking Edit, and then typing new values into the Range Editor panel. You also can position the slider pointer to a desired value and select either of the numerically labeled buttons to define a new endpoint of the range. |
Color Spectrum Edit |
Displays Color Editor panel. |
Surface |
Solution display options. Volume Isosurfaces : Display isosurfaces inside the domain. Boundary : Display solution on boundary. Stacked in X : Display solution on planes in X-direction Stacked in Y : Display solution on planes in Y-direction Stacked in Z : Display solution on planes in Z-direction |
No of Levels |
The number of isosurface values is selected with the Number of levels slider. The values are equally spaced between the inclusive range limits. If you select one level, its value is the Iso range slider value. |
Display / Motion |
These options control the appearance of the colors on the slicing planes. Isosurfaces Display and Motion could be colored using transparent, opaque, flat, fog, wireframe, and isolines. You choices determine the plot quality and the way the object will appear when the view is manipulated (moved/rotated) in the viewport. |
Apply |
This activates the isosurfaces. |
Dismiss |
Exits the panel. |
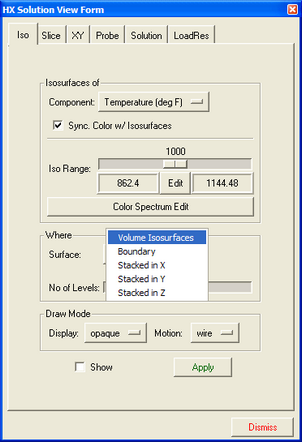
The Isosurface editor panel