Loop Results
Loop through loadcases and components to extract results and images for contours and notes.
This module allows you to capture the overview of the maximum, minimum, or hotspots of various result types such as Displacements, Stresses, and Margin of Safety for each combination of critical components and critical load cases in the model. This enables you to define and perform any specific use case for each combination of component and loadcases.
Adding a Loop Results Module
From the Report Ribbon, Add Modules tool group, click
 and select Loop Results
module.
and select Loop Results
module.Or
Navigate toNote: This module is available for both Document and Presentation modes.- Below are the properties associated with the Loop Results module:
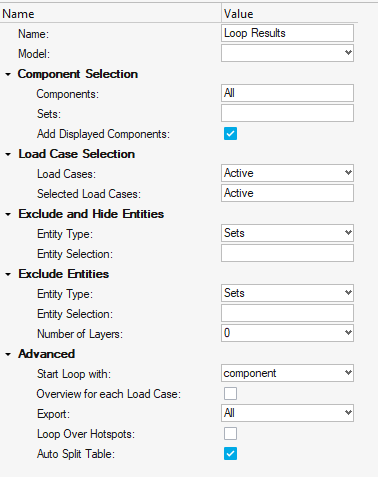 Figure 1. Note: The Loop Results properties are the same for Document and Presentation reports.
Under the Loop Results module, you can add the following Document report items:
- Chapter
- Text
- Image
- Table
- Page Break
For a Presentation report, add a Slide Layout or an Existing Slide under the Loop Results module.
- Name: Enter the title of the result loop.
- Model: Select the required page or window from the HyperWorks session.Note: As results are present in HyperView and Loop Results types are possible only in HyperView, solution displays only those pages or windows that have the HyperView client in the drop-down selection.
Component Selection
In loop results, it is necessary to select the components that you want to run and extract results for. You can select the components using the following options.
- Components: Select components for looping using the standard HyperView component selection option.
- Sets: Select the component sets for looping. Only sets of pool type User_Set are displayed.
- Add Displayed Elements: Select this checkbox to add the entities currently
displayed in the graphics area as a group.
Load Case Selection
- Choose Loadcase: Select the load cases to be used for looping. By default,
Active is selected.Load Cases options:
- Active - Active loadcase in the HyperView window.
- Last - Last loadcase in the list of loadcases of the results file.
- Multiple - Activates the Selected Load Cases option. This option allows you to select multiple loadcases from the Select Load Cases window.
Exclude and Hide Entities
- Exclude and Hide Entities: Select the entities that you want to be excluded from
results looping and to be hidden from the graphics area while capturing the
images.
- You can select the following entities to exclude and hide:
- Sets - Click Entity Selection to open the Select Sets window and select the required sets.
- Components - Click Entity Selection to select components from the graphics area.
Exclude Entities
- You can select the following entities to exclude and hide:
- Exclude Entity Type: Select the entities in the model to be excluded from the
looping.
- These entities will not be hidden from the graphics area while capturing images.
- You can select following entities to exclude:
- Sets - Click Entity Selection to open the Select Sets window and select the required sets.
- Components - Click Entity Selection to select components from the graphics area.
- Number of Layers: Select number of layers of adjacent elements to be excluded in
addition to the entities selected above.
Advanced Settings
- Start Loop With: Specify whether the loop is to be started with a component or
load case.Note: The columns and the rows in the Interactive Result Table that come up on loop execution would also be interchanged based on this selected option.
- Overview of each Load Case: Select this checkbox to view the overview for each load case in the result. Complete overview takes the current set view of the model on the selected page/window. Results are shown without the scale factors.
- Export: Export the Loop Results to Document or Presentation.Below are the options available in the Export settings:
- All: All of the results are exported.
- Above: Results above the defined threshold value are exported.
- Below: Results below the defined threshold values are exported.
- Equal to: Results equal to the defined threshold value are exported.
- Critical: Results that are above the red limit defined in threshold user interface are exported. This option is shown only when the thresholds are defined.
- Overview: The overview results for each load case are exported. This option is shown only when the overview for each load case option is selected.
- Loop Over Hotspots: Loop over hotspots detected by Report. You have to enable additional features in Image to use this feature.
- Split Table: Split the interactive result table into smaller tables based on the maximum rows and columns specified.