MAC - Display Tab
The MAC utility's Display tab allows you to filter MAC results and select various plotting options using the MAC and COMAC sub-tabs.
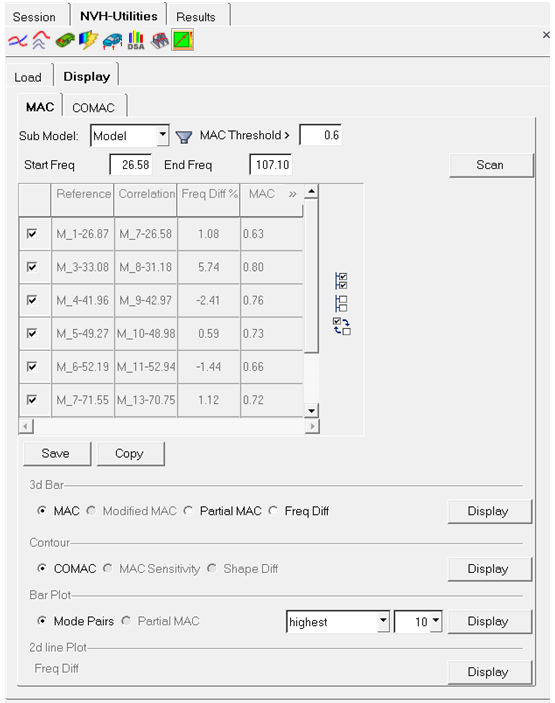
Figure 1. MAC Utility - Display Tab - MAC Sub-tab
MAC Results Filtering
MAC results can be filtered based on the MAC threshold or frequency range, and the resulting table can be copied to be pasted into a document or exported into a .csv for further processing.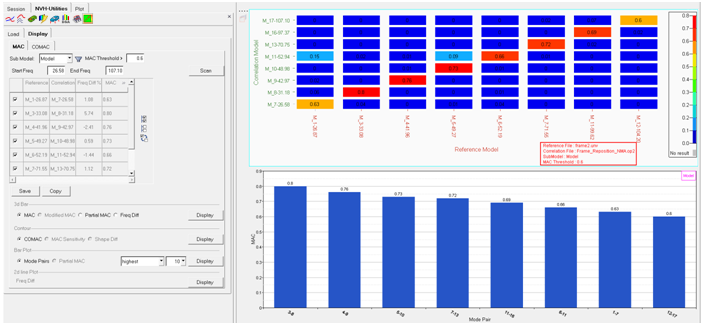
Figure 2.
Frequency Difference
Plots the difference in the frequency values for matching mode pairs.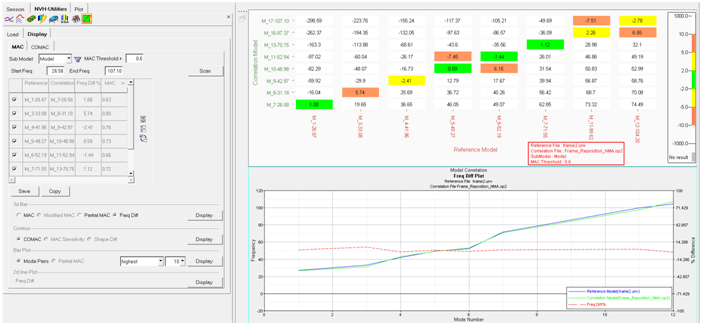
Figure 3.
Partial MAC (Submodels)
MAC values based on submodels (partial MAC) can be useful in determining which part of the structure is responsible for poor correlation.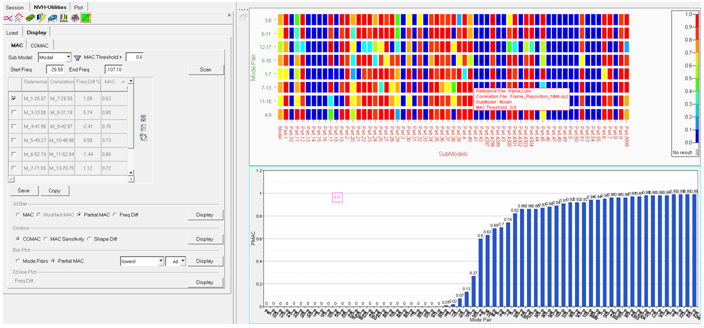
Figure 4.
Shape Difference Contour Plots
Shape difference is calculated by subtracting the results of the selected pair of modes. Higher values indicate bigger differences between the two vibration shapes.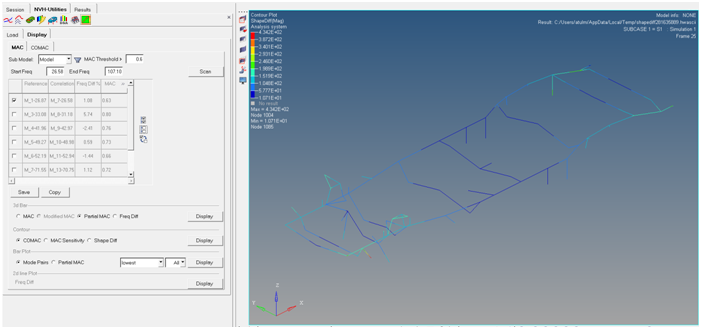
Figure 5.
CoMAC Contour Plots
Coordinate Modal Assurance Criterion (CoMAC) is a measure of correlation at the individual node level: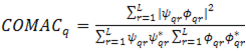
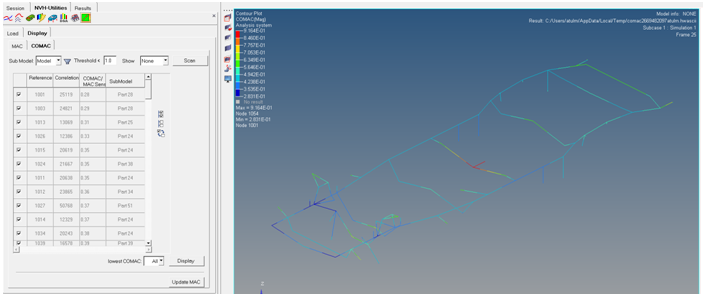
Figure 6.
MAC Sensitivity Contour Plots
Coordinate Modal Assurance Criterion (CoMAC) for a particular node pair with low MAC.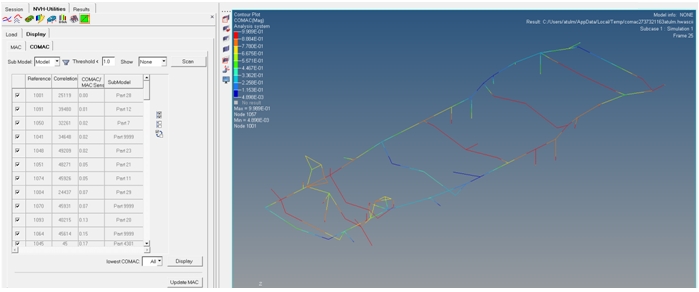
Figure 7.
MAC Modification Studies
Nodal sensitivity to MAC can be studied by excluding nodes with low CoMAC values. This can be done either by unchecking individual nodes in the CoMAC node table, or by filtering using the submodel filter. The resulting MAC is then calculated and compared to the original MAC.
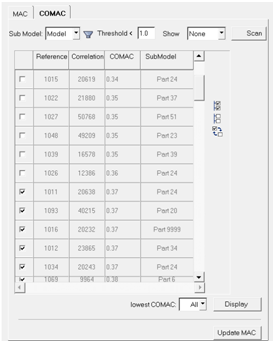 Figure 8. |
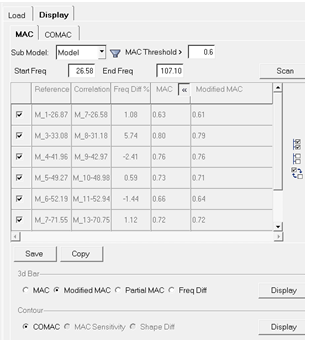 Figure 9. |
To activate the Display tab (and the MAC and COMAC sub-tabs), you must first load a file and select options from the Load tab.
MAC Tab
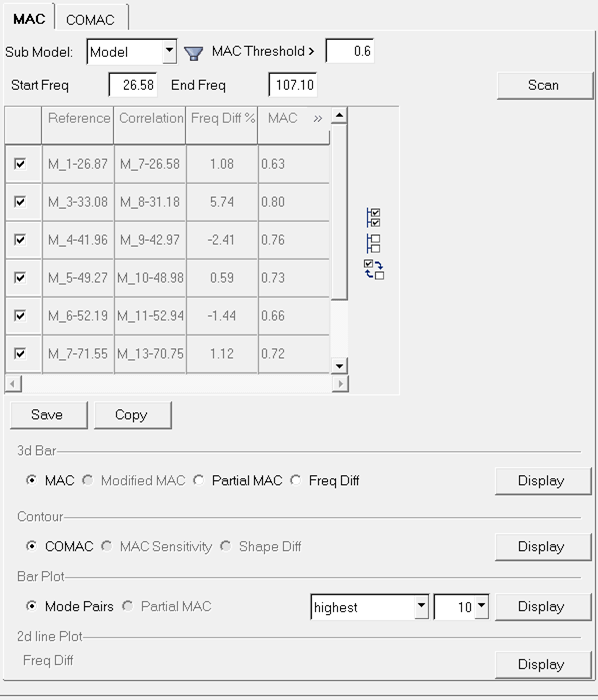
Figure 10.
| Sub Model | Use the drop-down menu to select a partial MAC (submodel) or the entire model for the corresponding plot. | ||
| filter |
Displays the Filter Submodels dialog, which can
be used to hide/show various submodels/components.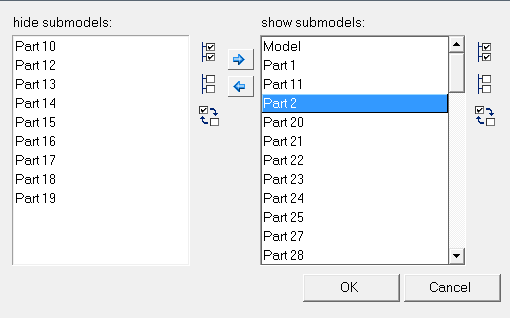 Figure 11. You can select items from the list by selecting them with your mouse or the arrow keys. Multiple submodels from the tree structure can be selected using the Ctrl and Shift keys. Use
the Add Selected Path Contributors Submodels
in each listing can be quickly selected/deselected using the Select All |
||
| MAC Threshold > | Enter a MAC threshold into the field (if desired). The default value is 0.6. | ||
| Start Freq | Enter the starting frequency into the field. | ||
| End Freq | Enter the ending frequency range into the field. | ||
| Scan | Click the Scan button to execute a scan of the filtered MAC results and display those results in a table. | ||
| MAC Table | Contains a list of mode pairs with the following
information displayed in the table:
A check mark indicates that the item/mode pair will be included in the scan. You can also use the Select All, Select None, and Select Reverse buttons to quickly select/deselect items (see below). |
||
| Select All |
Selects all items in the table. | ||
| Select None |
Clears all items currently selected. | ||
| Select Reverse |
Reverses the selection for each item. For example, a selected check box is deselected. | ||
| Save | Click the Save button to export the table into a .csv file for further processing. | ||
| Copy | Click the Copy button to copy and paste the table into a document. | ||
| 3d Bar | Select one of the 3D bar chart plotting options below: | ||
| MAC | Activate this option to plot the MAC. | ||
| Partial MAC | Activate this option to plot the Partial MAC. This is useful in determining which part of the structure is possible for correlation. | ||
| Modified MAC | This option is automatically activated whenever the Update MAC option is used in the COMAC tab. | ||
| Display | Click the Display button to plot the MAC, Partial MAC, or Modified MAC. | ||
| Contour | Select one of the contour plotting options below: | ||
| COMAC | Activate this option to plot a COMAC contour. See the COMAC tab below. | ||
| MAC Sensitivity | Activate this tab to plot a COMAC contour for a particular node pair. | ||
| Shape Diff | Activate this option to plot a shape difference contour. calculated by selecting results from the filter mode pair. in the resulting contour plot, higher values indicate a bigger difference between the two vibration shapes. | ||
| Display | Click the Display
button to plot a Shape Difference or COMAC contour plot. Note: You can adjust the
Shape Difference and CoMAC contour plots displayed in HyperView by moving the contour value slider located in the
Iso panel.
|
||
| Bar Plot | Select one of the bar chart plotting options below: | ||
| Partial MAC | Activate this option to plot the Partial MAC. | ||
| Mode Pairs | Activate to plot the Mode Pairs contained in the entries selected in the table. | ||
| highest/lowest | Use the drop-down menu to plot the mode pairs with the highest or lowest MAC numbers. | ||
| value | The value of the highest or lowest MAC number. | ||
| Display | Click the Display button to plot the bar chart. | ||
| 2D Line Plot | |||
| Freq Diff | Plots the difference in the frequency values for matching mode pairs. | ||
COMAC Tab
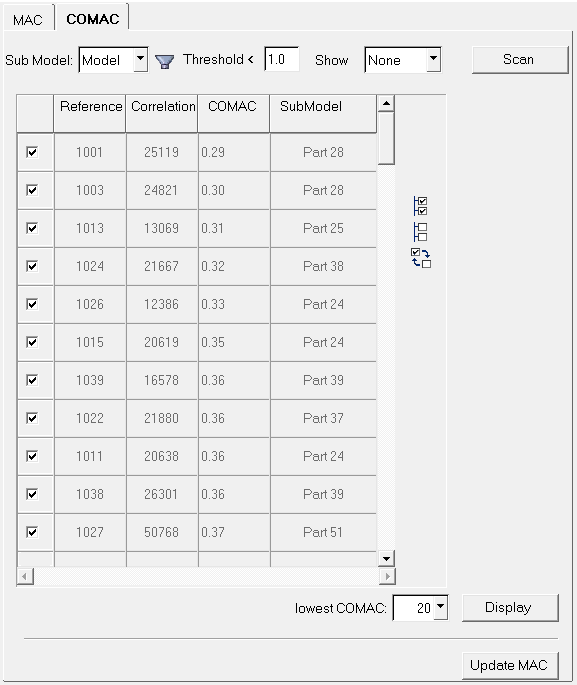
Figure 12.
| Sub Model | Use the drop-down menu to select a partial MAC (submodel) or the entire model for the corresponding plot. |
| filter |
Displays the Filter CoMac Submodels dialog, which can be used to
include/exclude submodel nodes.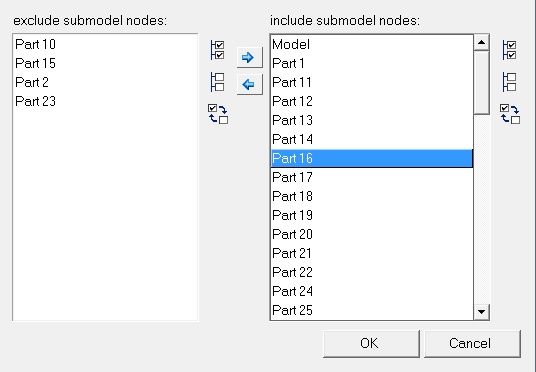 Figure 13. You can select items from the list by selecting them with your mouse or the arrow keys. Multiple submodel nodes from the tree structure can be selected using the Ctrl and Shift keys. Use the Add Selected Path Contributors Submodel nodes in each listing can be quickly selected/deselected
using the Select All |
| Threshold < | Enter a COMAC threshold into the field (if desired). The default value is 1.0. |
| Show | Use the drop-down menu to select None or Node Pair. |
| COMAC Node Table | Contains a list of nodes with the following information displayed in the
table:
|
| Display All |
Selects all items in the table. |
| Display None |
Clears all items currently selected. |
| Reverse Display |
Reverses the selection for each item. For example, a selected check box is deselected. |
| Scan | Click the Scan button to execute a scan of the filtered COMAC results and display those results in a table. |
| lowest COMAC | Allows you to plot the node pairs with the lowest COMAC. Click the drop-down menu to select a desired setting. |
| Display | Click the Display button to plot the COMAC. |
| Update MAC | It is also possible to study nodal sensitivity to MAC by excluding/filtering nodes with low COMAC values. Uncheck the boxes next to the Nodes in the table with low COMAC values, and also use the filter if desired, then click on the Update MAC button. The MAC tab is automatically displayed with the Modified MAC option activated. |