IIHS Front (25%) Intrusion
Load a File
- Side
- Choose from Driver Side or Passenger Side
- File type
- Select the solver output results file type. Options include:
- File name
- Click the file browser icon to select the output result file for the selected file type.
- Loaded files
- This option retrieves the previously loaded files in the same instance of the session. Click the down arrow to see the files loaded currently.
- Time History in Ref Coordinate System
- For time history files (nodout, binout, TH):
- Selected results file is validated for the selected file type.
- All node (response location) selection drop-down fields will be populated with the response location/node available in the result file.
- Intrusion with Seat Correction
- Subtracts the displacement of the seat mounts from the displacement values at the target intrusion points so that the new intrusion values will be free of any errors due to any deformations after the seat. All values are first calculated based on the reference coordinate system and then seat corrections are made. This correction helps to determine exact values of intrusions faced by the occupant.
- Align with Global T = 0
- Activating this option aligns the local system with global at the first animation frame when Time = 0 and performs the intrusion calculations.
- Dynamic Max
- Enables the calculation for every point individually for its maximum deformation out of all simulation steps instead of reading only the final timestep.
Ref coordinate system
This option resolves displacement with respect to the local system. If displacement is resolved in the results file, then intrusion should be calculated without resolving displacement.
- Origin
- Select nodes for the d3plot and H3D files.
- Click the arrow,
 , to pick nodes from drop-down menu. For
animation files, node numbers can be typed in.
, to pick nodes from drop-down menu. For
animation files, node numbers can be typed in. -
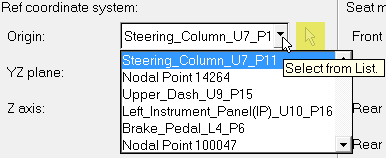
Figure 1.
Seat mounts
The seat mount inputs (rear right/left) are activated after selecting
Intrusion of Seat Correction. Please select the respective Time
History channel for coordinates of the node at the respective positions. In case of
animation files, the node can be picked from the screen. Thus, this input needs to
be:
- Requested from the solver for time history files (T01, nodout,
binout)
Or
- Picked on the screen for animation files (H3D, A01, d3plot)
Measurement points
Select the node ID for each measurement point listed. Locations include:
- Lower Hinge Pillar
- Lower Hinge Pillar z+0
- Lower Hinge Pillar z+75
- Lower Hinge Pillar z+150
- Foot Rest
- Left Toepan
- Brake Pedal
- Parking Brake
- Rocker Panel
- Rocker Panel x+200
- Rocker Panel x+350
- Rocker Panel x+500
- Steering Column Mid
- Upper Hinge Pillar
- Upper Hinge Pillar z+450
- Upper Hinge Pillar z+525
- Upper Hinge Pillar z+600
- Upper Dash
- Left Instrument Panel
- Vehicle CG
Curve Options
Allows you to edit the following curve display options:
- Title
- The curve name.
- Mode
- The standard modes available to plot curves. From the drop-down menu, select Append, Overlay or Replace.
- Style
- Select the curve line style.
- Width
- Select the curve line width.
- Color
- Select the curve line color from the palette.
- Additional Points
- Click to display the Additional Measurement Points dialog, where you can pick the location and node ID for additional points.
- Load/Save defaults
- User-specified inputs can be saved as a default file (.def) and can be loaded again for future use. Reference coordinate system points, seat mount points, measurement points and curve options are saved in the default file.
- Export Intrusion
- Exports the last calculated intrusion values into a text file. An exported intrusion text file can be reused later by selecting Saved intrusion data as the file type and selecting the respective file.
- Apply
- Upon clicking Apply, the following steps are
performed to plot the final results:
- Validate inputs.
- Calculate intrusion for all measurement points.
- Plot the intrusion plot with standard regulation limit plots. Intrusion values are also tabulated in a separate TextView window.