Visualize Linear Effects
Visualize the relative effects that design variables and output responses have on DOE explorations.
-
From the Design Explorer ribbon, Evaluate tool group, click the
Results Explorer tool.

Figure 1.The Results Explorer browser opens. -
In the Results Explorer browser, click the Linear
Effects icon
 .
.
-
Visualize the results using the table and the modeling window.
The linear plot in the Results Explorer browser shows the relative effect that a design variable has on the model for a selected response. The larger the number, the larger the impact of the given variable, relative to the other variables. The coloring of the effects indicates whether a given effect has a positive or negative effect.Positive effects are shown in shades of blue and indicate that a positive change in the design variable results in a positive change on the response.Negative effects are shown in shades of brown and indicate that a positive change in the design variable results in a negative change on the response. For example, an increase in the Rib_01_flange thickness variable is expected to result in a significant decrease in the Z-displacement response, relative to all other variables.
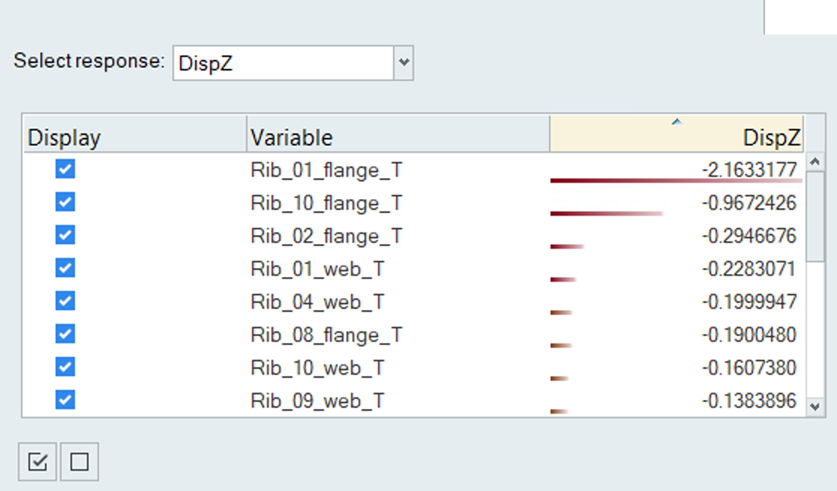
Figure 2.The contour plot and legend in the modeling window help you to further visualize the linear effects.
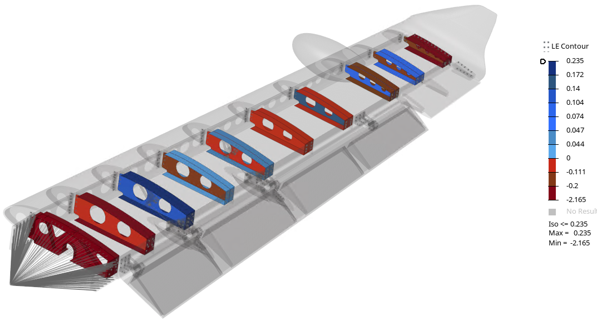
Figure 3.