HV-6000: Creating Measures for an FEA Model
In this tutorial, you will learn how to view the minimum and maximum values of results applied, create a measure group, and plot a measure created.
This exercise uses the d3plot file located in the
animation\truck folder as both the model and results
file.
Measures are created and displayed in the Results Browser and edited using the Entity
Editor.
- To create a Measure, right-click in the Results Browser and select Create >
Measure from the context menu.
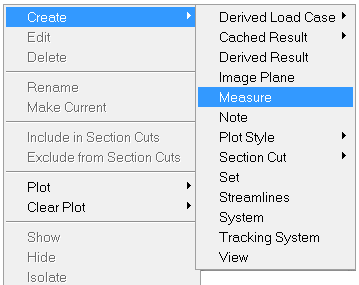
Figure 1. - To edit a Measure, select it in the Results Browser to see the properties in
the Entity Editor.
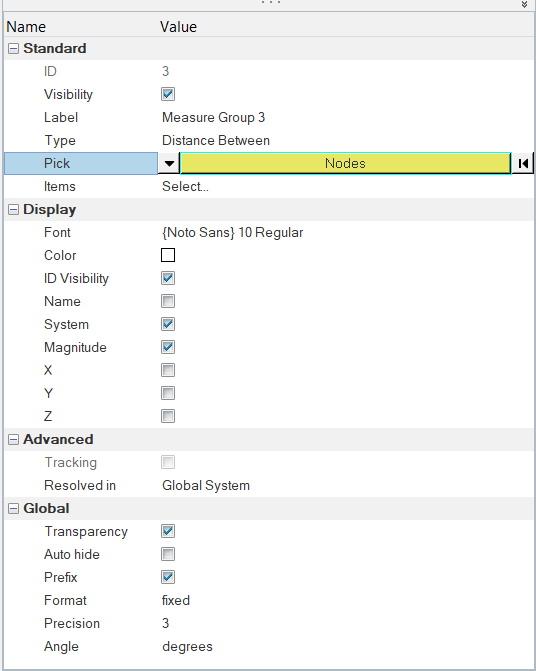
Figure 2. - To display the Measure, click on the icon
 next to the measure in the Results Browser.
 - To hide a displayed Measure, click on the icon
 next to the measure in the Results Browser.
Measures allow you to measure the distance between nodes, position of coordinates, relative displacement, relative angle, and angle between nodes. Measures also allow for the measuring of nodal and elemental contour values. See the Measure panel for additional information.
Create a Measure for the Minimum and Maximum Results
-
Click the Contour panel button
 on the Result toolbar
to enter the Contour panel.
on the Result toolbar
to enter the Contour panel.
-
Animate the model
 .
.
-
Click the icon next to the Static MinMax Result measure
to display the values.
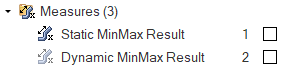 Figure 3.
 The minimum and maximum values are displayed across all time steps.
-
Under the Global section in the Entity Editor, uncheck the Transparency check
box.
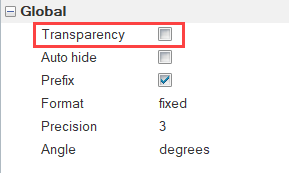 Figure 4.
 The measure is displayed on a background.
The minimum and maximum values are displayed across all time steps.
 Figure 5.
 -
Click the icon next to the Static MinMax Result measure to turn off the display.
-
Click the icon next to the Dynamic MinMax Result measure to display the values.
The minimum and maximum values are displayed for each time step.
-
Click the icon next to the Dynamic MinMax Result measure to turn off the display.
Create a Measure for the Distance Between Two Nodes
-
Under the Standard section in the Entity Editor, verify that Distance Between
is the option set for Type.
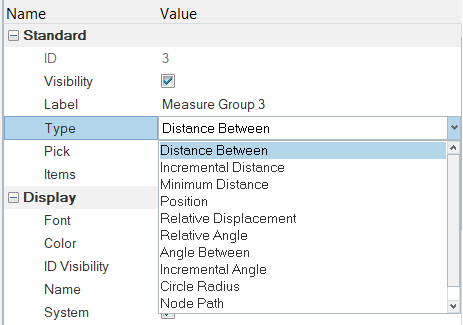 Figure 6.
 -
Under the Display section in the Entity Editor, verify that the ID Visibility,
System, and Magnitude boxes are checked.
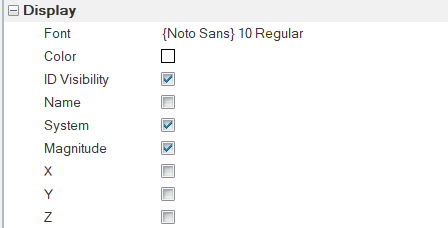 Figure 7.
 -
From the Format drop-down menu, select Fixed.
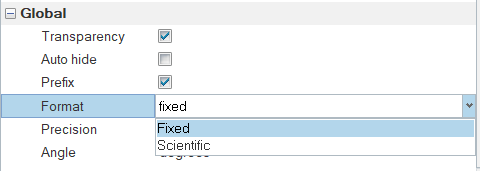 Figure 8.
 -
Set the Precision setting to 2.
The measure is now displayed in a fixed format with 2-decimal digit precision.
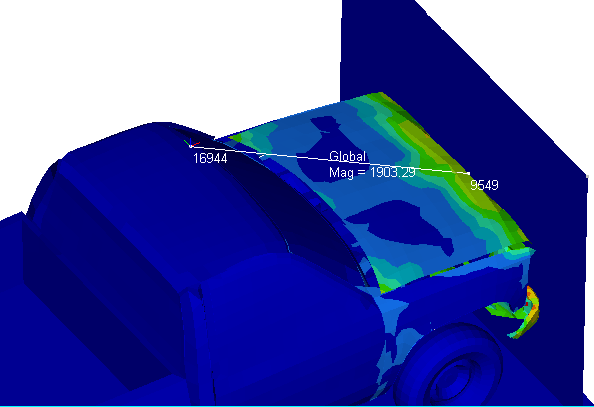 Figure 9.
Create a Measure for Nodal Results Using a Live Link
-
Select one of the nodes in the list.
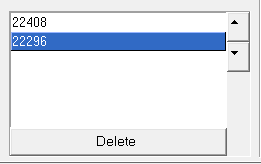 Figure 10.
 -
From the Place on drop-down menu, select Preview
Plot.
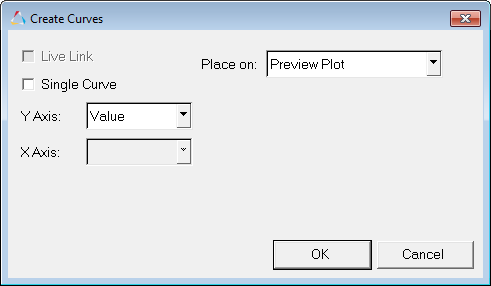 Figure 11.
 -
Click OK.
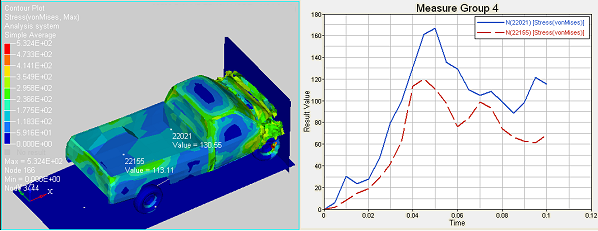 Figure 12.
 -
In the Contour panel change the Result type to
Displacement(v) and click
Apply.
Observe the change in the plot window.
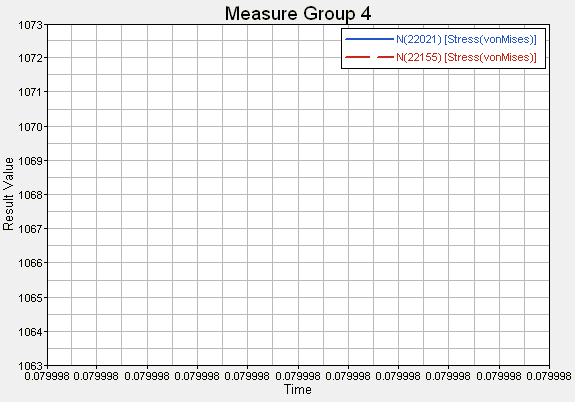 Figure 13.
 -
Animate the model.
The Live link option updates the plot for the new contour applied.
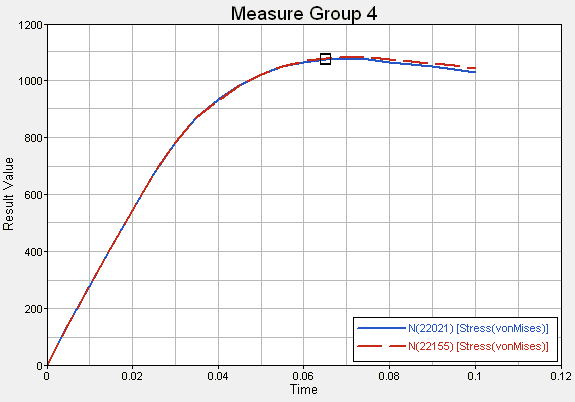 Figure 14.
Create a Bar Chart of the Measured Values
-
Click in Window 2 and use the plotting type drop-down menu to change the
plotting type from XY Plot to Bar Chart.
 Figure 15.
 -
Select Yes to the message window which appears asking if
you want to erase the data in the window.
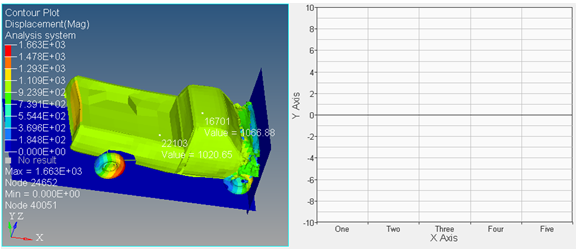 Figure 16.
 -
For Place on select Existing Plot, and in the tree below
select Window 2.
 Figure 17.
 -
Activate both the Live Link and Single
Curve options, and keep the other options the same as entered in
the steps above.
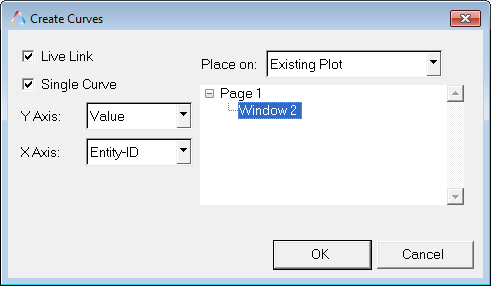 Figure 18.
 -
Click OK.
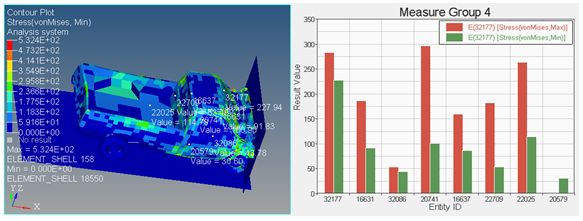 Figure 19.
 -
Click Apply.
Note: The second curve created in the bar chart updates, this is because Live Link was selected for the second curve and not the first.
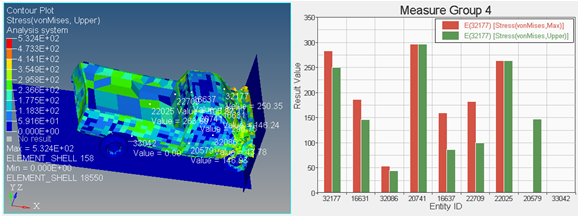 Figure 20.
 -
Return to a single window layout by clicking the arrow next
to the Page Window Layout button
 on the Page Controls toolbar, and selecting the single window layout
  .
.
Create a Minimum Distance Measure Between Two Entities
-
Click OK to dismiss the dialog.
The measure is now displayed in a fixed format with 3-decimal digit precision.
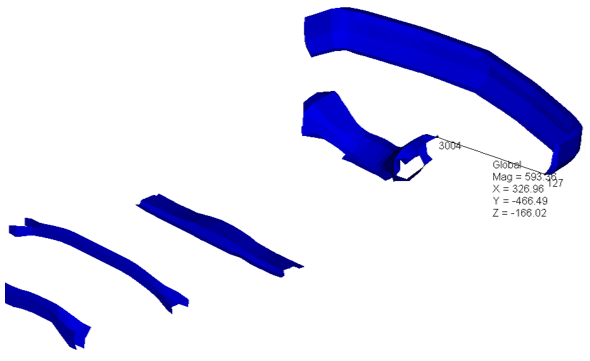 Figure 21.
 -
Animate the model.
The distance between the two entities is updated with the animation. Since minimum distance is calculated at each time step between the two entities, notice how as the animation is played the location and the value of the minimum distance measure gets updated.
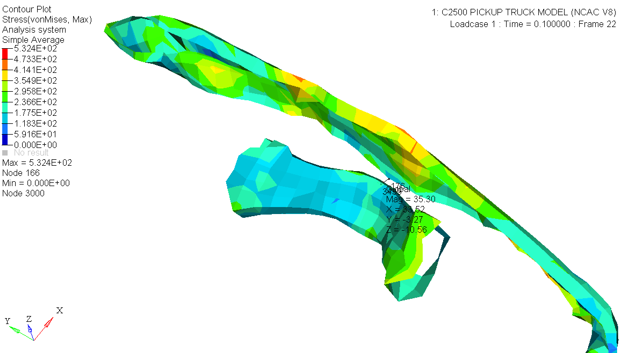 Figure 22.