HVVH-6020: Solution Tab - Verify OptiStruct Results with MAC
Comparison
Perform a verification based on the Modal Assurance Criterion (MAC) for the OptiStruct solver (NVH).
From the Solution tab, select the Solver version result
comparison tab.
From the Solver type list, select OptiStruct.
From the Tolerance list, select the default (1e-06). You
can set any tolerance for Scalar, Vector, or Tensor data types.
From the Result list, select H3D.
Under Current, in the Load Model and Load Result fields, click the file browser
icon, , to load the NMA_1.h3d file, located in
..\tutorials\hvvh\Solution\ Optistruct\Mac\.
Under Reference, for the Load Model and Load Result fields, click to load
the NMA_2.h3d file, located in
..\tutorials\hvvh\Solution\ Optistruct\Mac\.
In the Output directory field, click to
select an output directory.
Click the MAC check box.
Click the Mac Only button.
The mac calculations start and correlation plots and mode pairs bar plot
are generated.
Note: The default config file that contains frequency information
and the number of MAC values to calculate is available in the current
results directory. For example, NMA_1_mac.cfg. This can
be changed for different MAC calculations and
comparisons.
Click Apply.
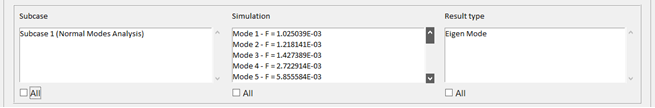
The results available (subcase, simulation, and result type) in the
current result file are loaded in the three windows. Figure 1.
Select All under each of the windows and click the
second Apply button.
Any combination of Subcase, Simulation, and Datatype can be selected for
comparison. Comparisons of the current and reference results are
generated.
In the Messages window, the run details and log file
location are displayed.
If the difference is greater than the tolerance, it is indicated with the
label Fail; otherwise they are labeled Pass.
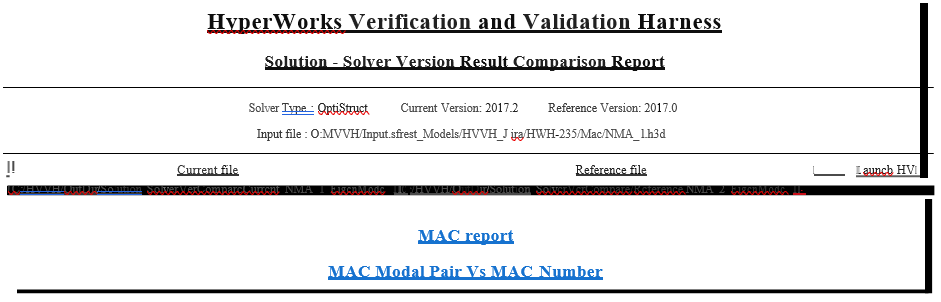
Click HTML Report to view the HTML report.
Comparisons between different data types are available.
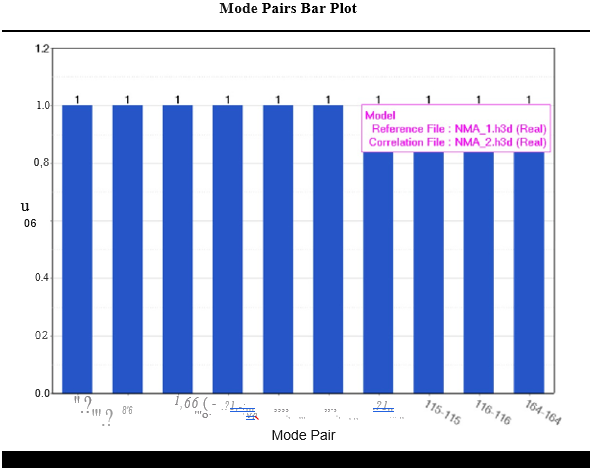
From the HTML report, click MAC report to open the
correlation plot and mode pair bar plot.
Figure 2. Figure 3. Figure 4. Figure 5. Figure 6.
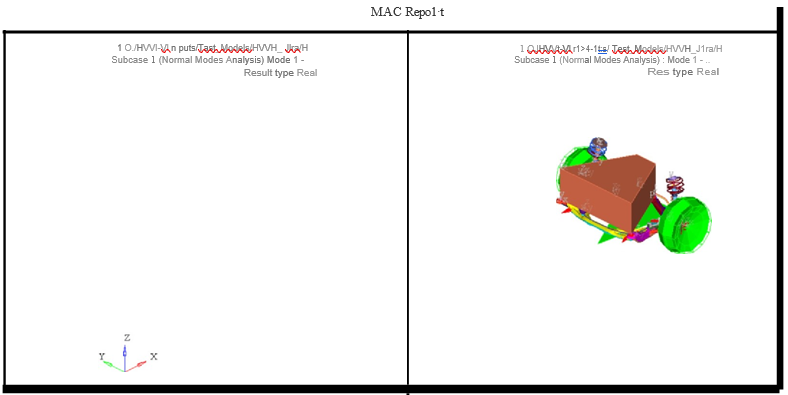
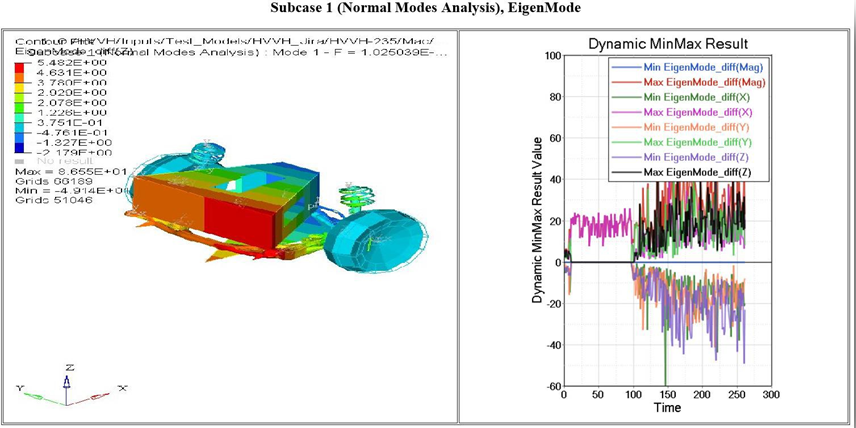
Click the first column of the table to open a new modeling window.
Figure 7.
In the image above, the left window shows a diff contour (Current-Reference)
and the right window shows a diff plot in HyperGraph.
If the difference is greater than the tolerance, it is indicated with the
label Fail; otherwise they are labeled Pass.
Click the left window to open the diff-values in H3D in HyperView Player.
You can view the difference in the contour and view the area where there is a
difference in case of a failure.
Click the right window to maximize/minimize the plot.
The difference values for each step are calculated and the min and max values
of the difference are plotted. If all the values match and no difference is
seen, the curve is a flat line and the diff contours have values less than the
tolerance.
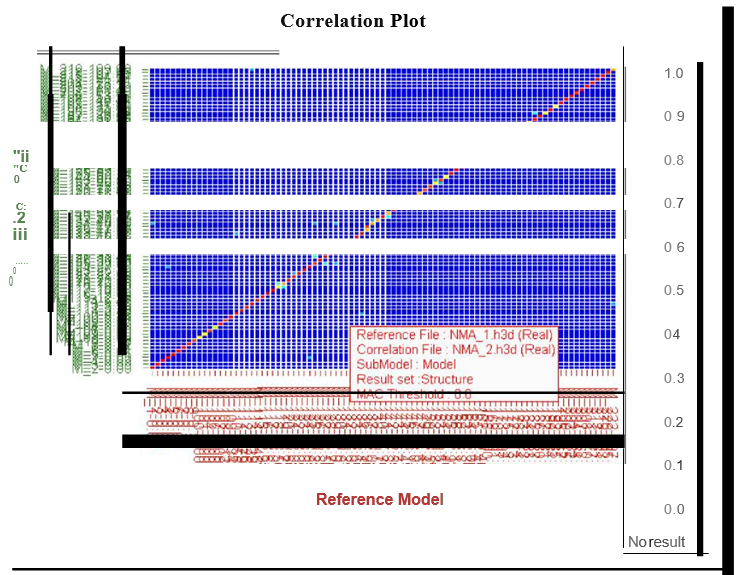
From the HTML report, click the link to the MAC report to open the correlation
plot and the mode pair bar plot.
This gives information on the model correlation across two results and the
modal pairs with different MAC numbers.
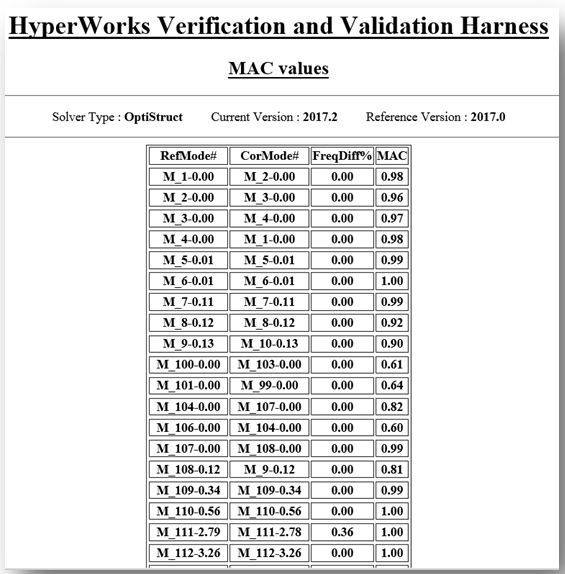
Mode number, frequency, percent frequency difference, and MAC values are
listed in the MAC table.
 , to load the NMA_1.h3d file, located in
..\tutorials\hvvh\Solution\ Optistruct\Mac\.
, to load the NMA_1.h3d file, located in
..\tutorials\hvvh\Solution\ Optistruct\Mac\.