plotyy
Plots given datasets in independent y-axes and a common x-axis.
Syntax
plot(x1, y1, x2, y2)
ax = plot(x1, y1, x2, y2)
[ax h1 h2] = plot(x1, y1, x2, y2)
Inputs
- x1, y1
- Dataset to be plotted in the first y-axis.
- x2, y2
- Dataset to be plotted in the second y-axis.
Outputs
- ax
- A vector containing the handles of the two y-axes.
- h1
- Handle of the first line graphics object.
- h2
- Handle of the second line graphics object.
Examples
Simple example:
clf;
x = [0:0.1:2*pi];
plotyy(x, sin(x), x, 2*cos(x));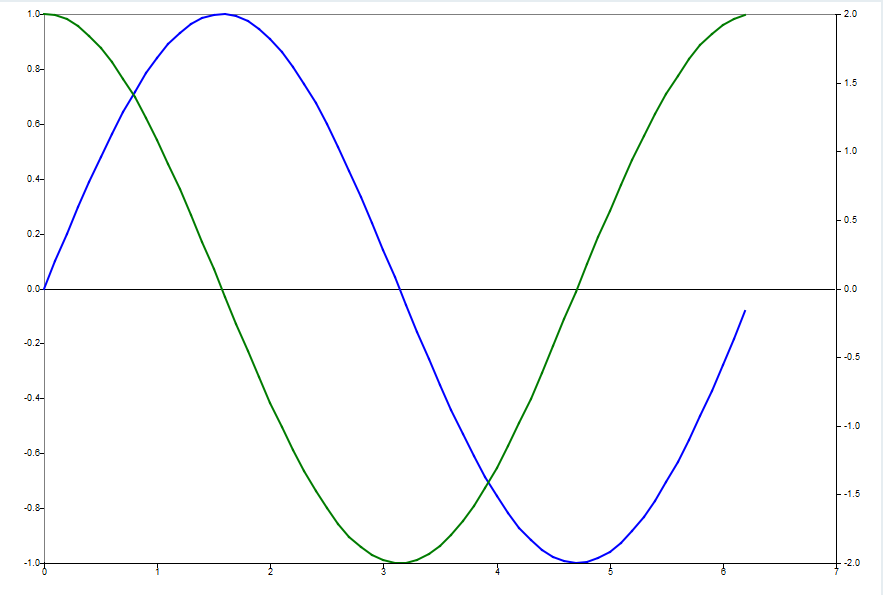 Figure 1.
 Set secondary axis properties:
clf;
x = [0:0.1:2*pi];
[ax h1 h2] = plotyy(x, sin(x), x, 2*cos(x));
set(ax(1),'fontsize',12);
ylabel(ax(2), 'Y2 axis label');
ylim(ax(2), [-4 4]);
set(ax(2),'ycolor',[0 120 0]);
set(ax(2),'ytick',5);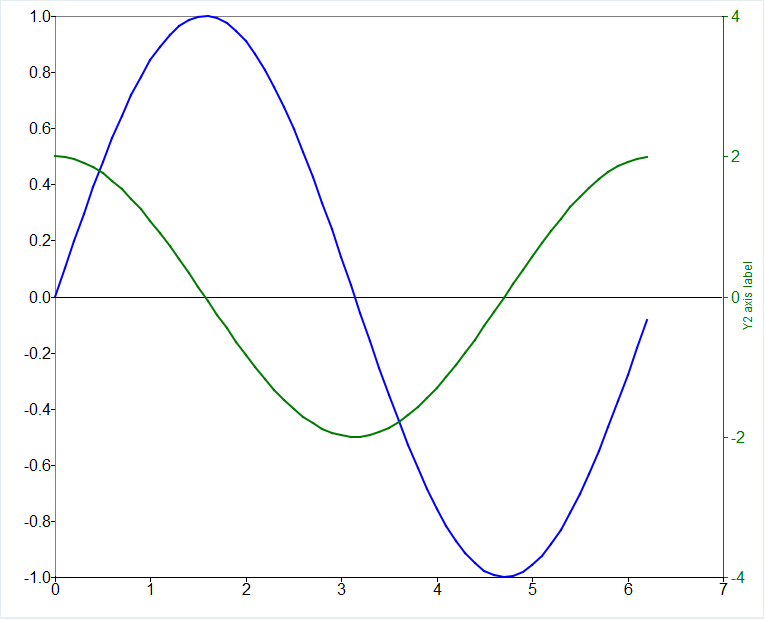 Figure 2.
 Add a curve in an existing secondary axis:
clf;
x = [0:0.1:2*pi];
[ax h1 h2] = plotyy(x, sin(x), x, 2*cos(x));
hold
plot(ax(2), x, 4*cos(x));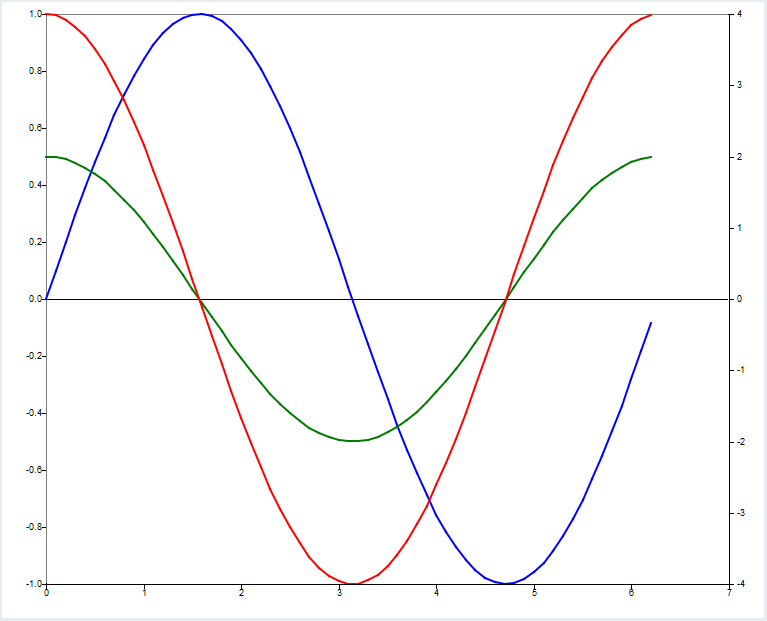 Figure 3.