|
Visualization Title
Each Tab or dashboard in a workbook provides a view of your data that will normally include one or more data visualizations, filters, and legends.
You can move between dashboards within the workbook by clicking the appropriate tab.
Adding Visualization Title
-
Click on the Click here to enter title bar at the top of the visualization.

-
Enter your new Visualization Title.

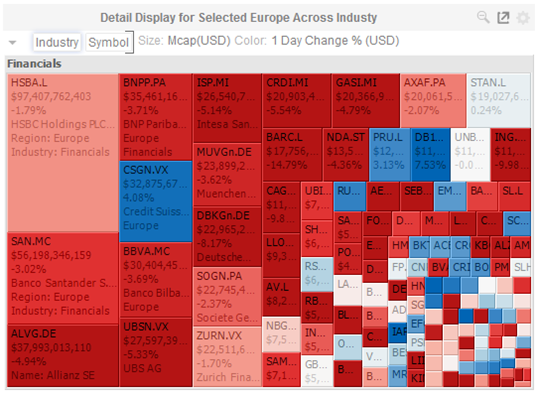
If you do not change the default title, the visualization title will be hidden when you publish the dashboard to the Panopticon Visualization Server or view it in Panopticon Designer (Desktop)’s Presentation Mode:
-
-
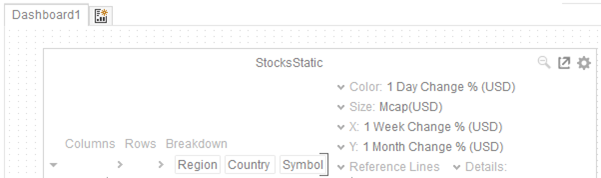
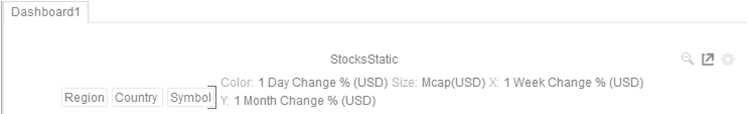
Design Mode
-
-
-
Presentation Mode
-
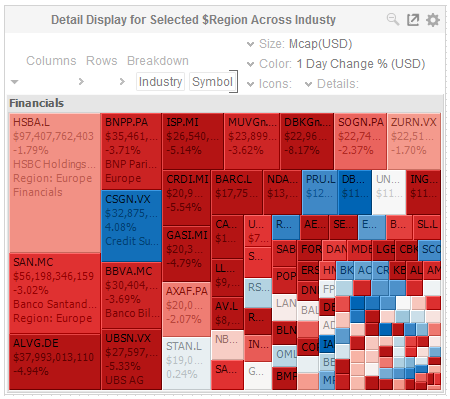
Visualization titles can also be parameterized, displaying the values for dashboard parameters, and for visualizations linked to Time Series data sets the snapshot time.
Dashboard parameters are added to the title within curly brackets (for example {Company} ).
The snapshot time is added to the title by using {Snapshot}.
Inserting parameter values by typing the parameter name preceded by a dollar sign, for example $Symbol, is still supported for backwards compatibility.
-
-
Presentation Mode
-
-
-
Design Mode
-