|
Adding Visualizations to a Dashboard
Adding Visualizations to a Dashboard
-
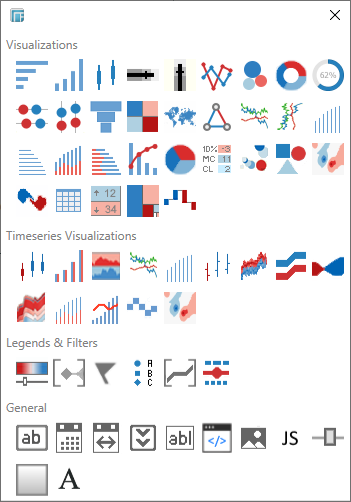
Click on a Visualization in the Parts dialog.
You must be in Design Mode to add visualizations to a dashboard.
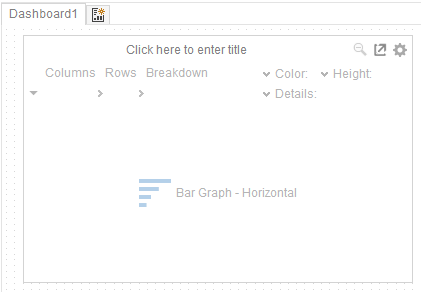
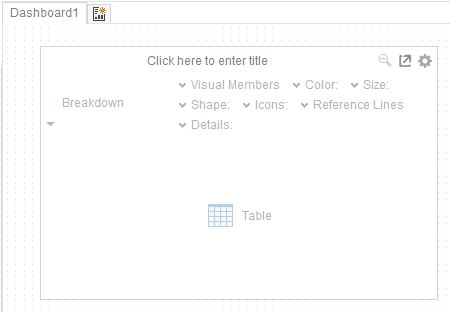
The selected visualization is displayed in the canvas.
-
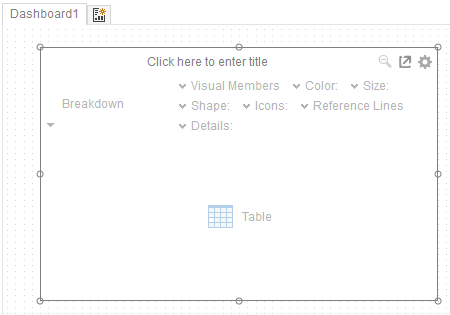
Reposition the visualization on the Dashboard Canvas and size it by grabbing the corners of the visualization.
Each visualization consists of five components:
-
-
Title
-
Settings
-
Breakdown Shelf (which may include Cross Tab Rows & Columns)
-
Variable Shelf
-
Visualization Display Area
The variables available on the Variable Shelf will depend on the visualization selected.
-
-

-
-
-