|
Numeric Line Graph Settings
Numeric Line Graphs differ from the standard line graph in that they have a numeric X axis, rather than one based upon time.
They are commonly used in both scientific and financial scenarios to show trends in functions that are based on two numeric inputs (X and Y).
Common uses include the display of Yield Curves.
Numeric Line Graphs can also be used to display selected cuts through a Surface Plot.
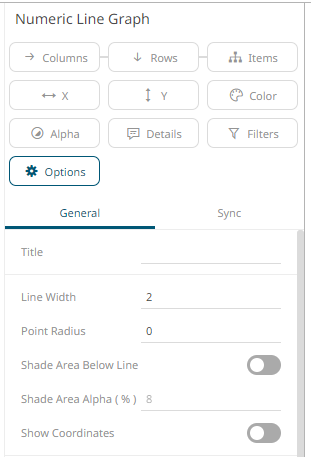
The numeric
line graph settings pane is displayed after clicking the Options  button.
|
Setting |
Description |
|
Line Width |
Specifies the width in pixels of the lines. |
|
Point Radius |
Specifies the radius of each point in pixels that the line passes through. |
|
Shade Area Below Line |
Defines that alpha shades are applied between the lines and the zero Y grid line. |
|
Shade Area Alpha (%) |
Specifies the alpha (transparency) of the shaded area, expressed in percent 0-100 of the alpha value currently set on the line. |
|
Show Coordinates |
Determines whether the graph coordinates (i.e., X-Y plots, or Date/Time-Y plots) on mouse over are displayed in the visualization. |
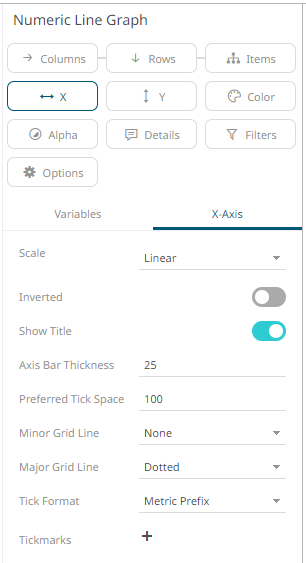
Other visualization-specific properties can be set by clicking on the X-Axis variable drop area and then selecting the X-Axis tab:
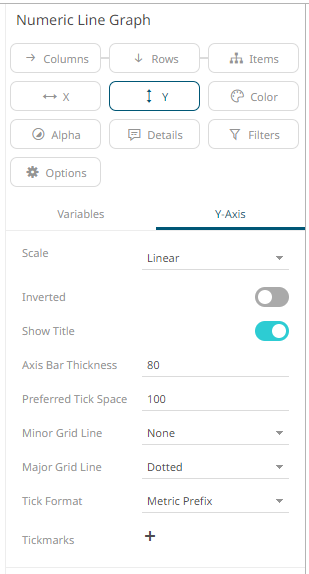
Or also, by clicking on the Y-Axis variable drop area and then selecting the Y-Axis tab: