


|
Visualizations Axes

The X and Y axes of visualizations may include the following settings when accessed from the Breakdown section:
|
Setting |
Description |
|
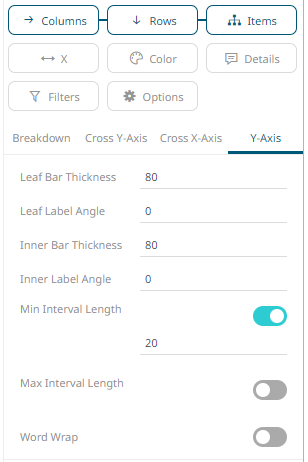
Leaf Bar Thickness |
The thickness of the leaf or lowest level of data. |
|
Leaf Label Angle |
The Label angle of the leaf or lowest level of data of the crosstab axis. Default is 0, accepts values between -90 and +90. |
|
Inner Bar Thickness |
The width or height allocated for the non-leaf components of the crosstab axis in pixels. Default is 80. |
|
Inner Label Angle |
The angle of the non-leaf labels. Default is 0, accepts values between -90 and +90. |
|
Min Interval Length |
The minimal interval in pixels between cross tabbed visualizations. Default is 20. |
|
Max Interval Length |
The maximum interval in pixels between cross tabbed visualizations. Default is 400. |
|
Word Wrap |
Determines whether to wrap the visualization axis text. |
Some visualizations may also include the following X and Y axes settings:
|
Setting |
Description |
|
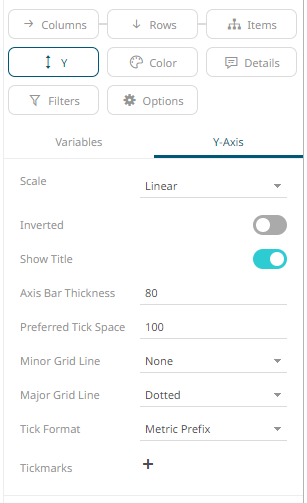
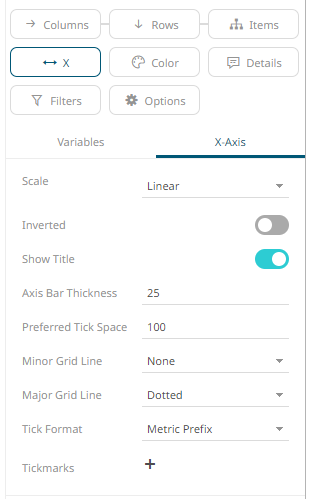
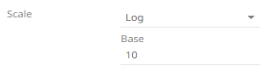
Scale |
Determines whether the scale of the axis is Linear, Log, or Power. · Linear – a change between two values is based on addition e.g., 30, 60, 90, 120, 180, etc. · Log - a change between two values is perceived on the basis of the ratio of the two values or based on multiplication. Once selected, the Base control displays with the value of the common base for the logarithmic scale (i.e., 10).
For example: log10(x) represents the logarithm of x to the base 10 e.g., 1, 10, 100, 1000, etc. You can opt to enter a new Base
value then click NOTE: Value cannot be lower than 2. · Power – Works according to the SIGN(MEASURE)*LOG10(MAX(1, ABS(MEASURE))) formula. Works like the Log scale except it can handle negative values and every value between -1 and 1 is set to 0. For example, for values between -100 and 100, the axis will be: -100, -10, 0, 10, 100 |
|
Inverted |
Determines whether the Y or Height axis (for Vertical) or X or Width axis (for Horizontal) is inverted. |
|
Show Title |
Displays an Axis Title label. |
|
Axis Bar Thickness |
The margin in pixels for the axis. If set to zero, the axis is removed. |
|
Preferred Tick Space |
The preferred space in pixels between the minor grid lines across the axis. |
|
Minor Grid Line |
How minor grid lines are drawn across the axis. Allowed values: None · Dotted · Dashed · Solid |
|
Major Grid Line |
How major grid lines are drawn across the axis. Allowed values: · None · Dotted · Dashed · Solid |
|
Tick Format |
Set to From Variable to use the format string that is on the current variable displayed in the axis. Set to Metric Prefix to format the Tick labels in the numeric axes using the metric prefixes. |
|
Tickmarks |
Click
Enter the Value and the Label. Click
|
 .
. to
add and set tick marks.
to
add and set tick marks.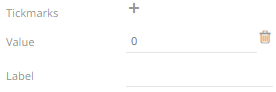
 to delete.