|
Surface Plot Settings
Surface Plots are used to identify trends and outliers within numeric surfaces.
The Surface is made up of a series of points where each point has:
q X Position
q Y Position
q Color (which represents the Z axis).
The Surface Plot can support data sets where the X and Y positions can both be regular and irregular in their distribution.
Additionally, the color scale can be continuous or stepped to show a surface gradient.
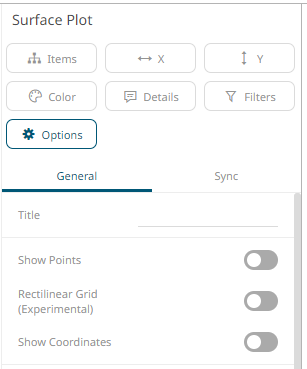
The surface
plot settings pane is displayed after clicking the Options  button.
|
Setting |
Description |
|
Show Points |
Determines whether surface data points are shown. |
|
Rectilinear Grid |
Determines whether distinct X and Y values are changed into a rectilinear grid where missing values are filled in with a default of zero (or the ground level). |
|
Show Coordinates |
Determines whether the graph coordinates (i.e., X-Y plots, or Date/Time-Y plots) on mouse over are displayed in the visualization. |
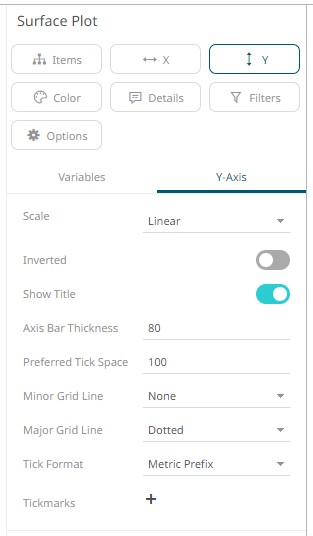
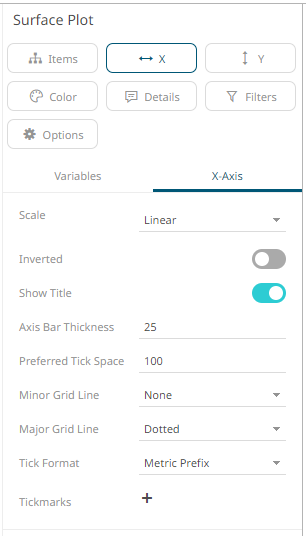
Other visualization-specific properties can be set by clicking on the X-Axis variable drop area and then selecting the X-Axis tab:
Or also, by clicking on the Y-Axis variable drop area and then selecting the Y-Axis tab: