


|
Shape Variable Configuration
The Shape variable is available in the Dot Plot, Map Plot, Scatter Plot, Scatter Plot 3D, Timeseries Combination, and Timeseries Scatter Plot visualizations.
|
NOTE |
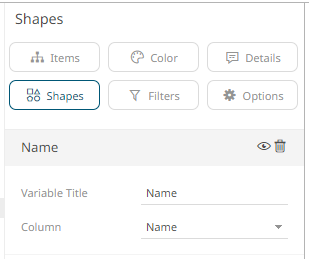
· The Shape variable in the Shapes visualization does not contain these properties.
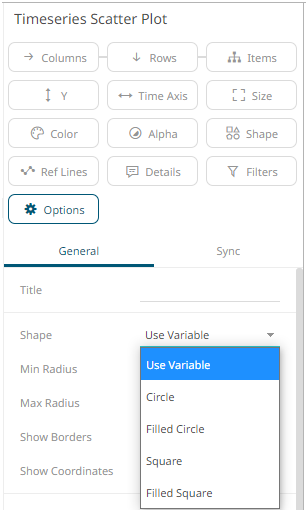
· This configuration is applicable when the Use Variable option is selected in the Shapes drop-down of the Timeseries Scatter Plot visualization settings pane. For example:
|
Steps:
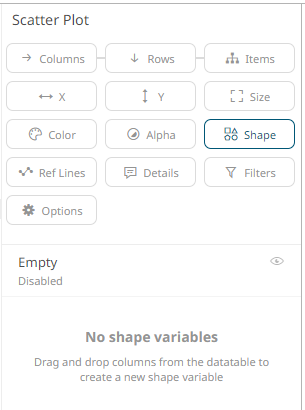
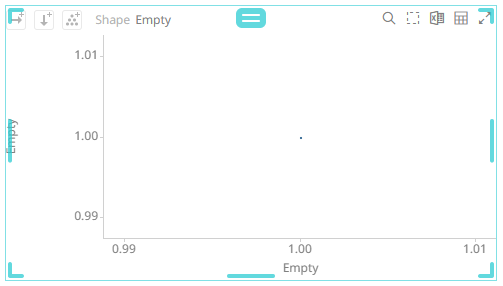
1. On the Visualization Settings pane, click the Shapes variable.
Initially, the variable has an Empty state.
2. Click the Empty value to expand its settings.
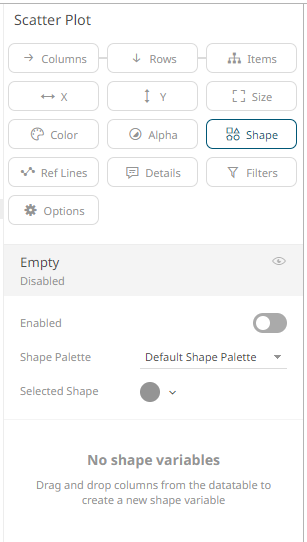
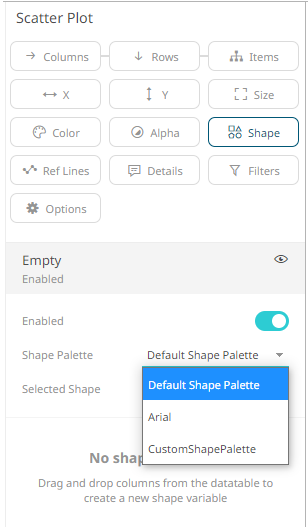
3. Tap the Enabled slider to turn it on. [Empty] currently displays as the associated value of the Shape variable with the Selected Shape set to FilledCircle.
You can opt to modify the Shape Palette settings:
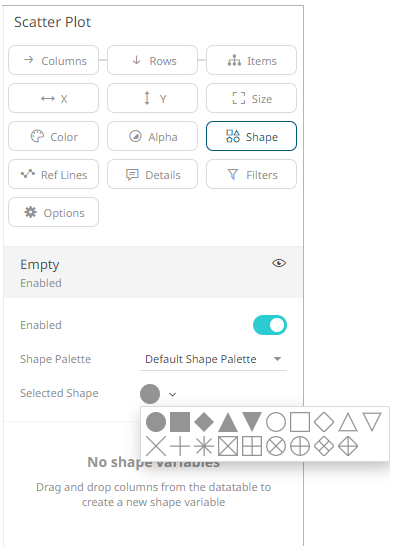
And then the corresponding Selected Shape:
|
NOTE |
There is a default shape palette with a set of geometric symbols, and a shape palette named Arial with capital letters A-Z. You can add your own custom shape palettes from SVG files in the Theme-editor of Panopticon Visualization Server. The SVG files added to a palette must follow the same rules as custom SVG files used with the Shapes visualization.
|
4. To associate other columns from the data table, drag and drop them to the Shape variable drop area. Select one to display the corresponding configuration pane.
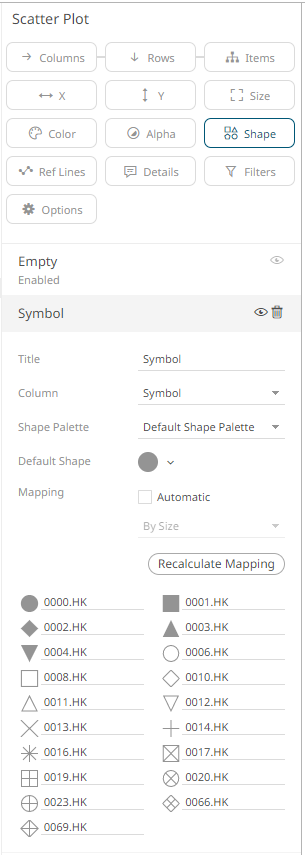
5. Enter the label of the Shape variable in the Title field.
You can parameterize the variable title to support dynamic schema in the dashboards.
6. You can also change the column to the be used as the Shape variable from the Column drop-down list.
7. Select the Shape Palette.
8. Click
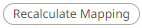 to
recalculate the mapping of the selected column values to the shapes.
to
recalculate the mapping of the selected column values to the shapes.
9. For columns that are not mapped to a shape, select the Default Shape to be used.
10. Checking the Automatic Mapping box enables the Modes drop-down list:
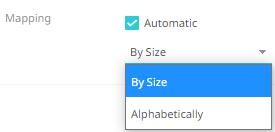
11. You can either assign the shape assignment when new data is dynamically loaded into the visualization:
· By Size
The shape assignment is based on the Size variable.
· Alphabetically
The shape assignment is done alphabetically.
12. Click the Save  icon on the toolbar.
When
saved, the  notification is displayed.